Spectroscopic sensing · 2025–present
Generalisable deep learning for microbial SERS
Standardising surface-enhanced Raman spectra across instruments, recognising sepsis pathogens from blood, and examining how well microbial SERS models are validated.
Two research papers, one evidence review and ongoing work on spectral transfer
Approach
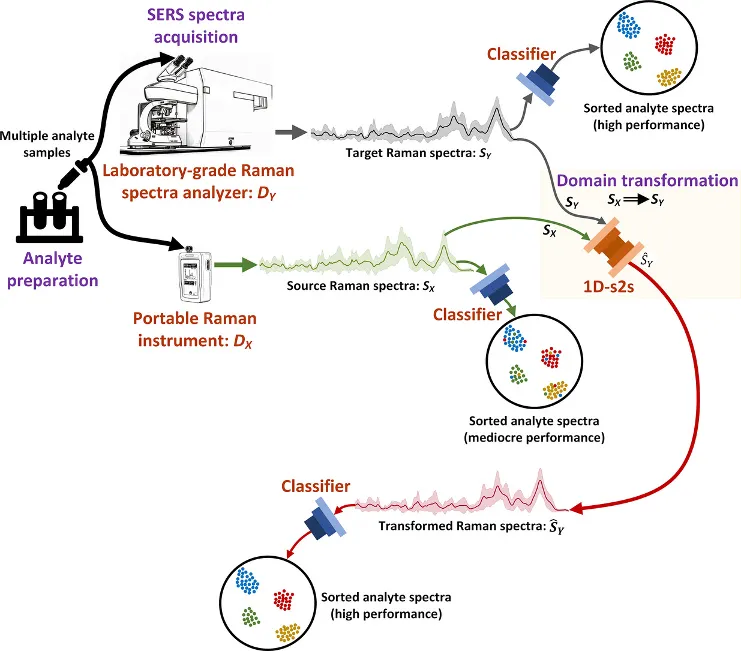
Surface-enhanced Raman spectroscopy (SERS) can detect microbial signatures quickly, but spectra change with the instrument, substrate, sample and acquisition conditions. Strong results can also be misleading when spectra from one biological sample appear in both training and testing. This project addresses those problems by standardising spectra across instruments, testing sepsis and pathogen recognition on blood-derived samples, auditing validation practice across the field, and extending spectral mapping to analytes unseen during training.
- Acquire and standardise spectra
- Recognise analytes and pathogens
- Test independence and transfer
Standardising SERS spectra across instruments
Spectrochimica Acta Part A · 2026 · Online 2025
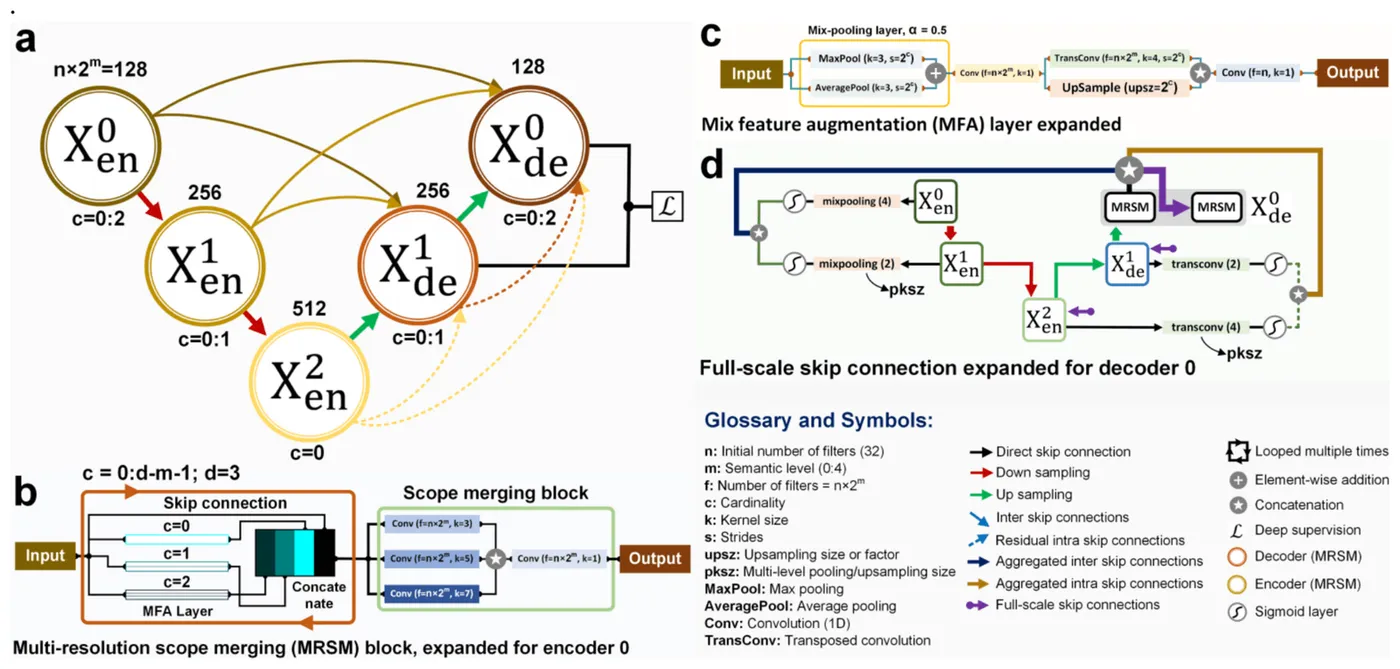
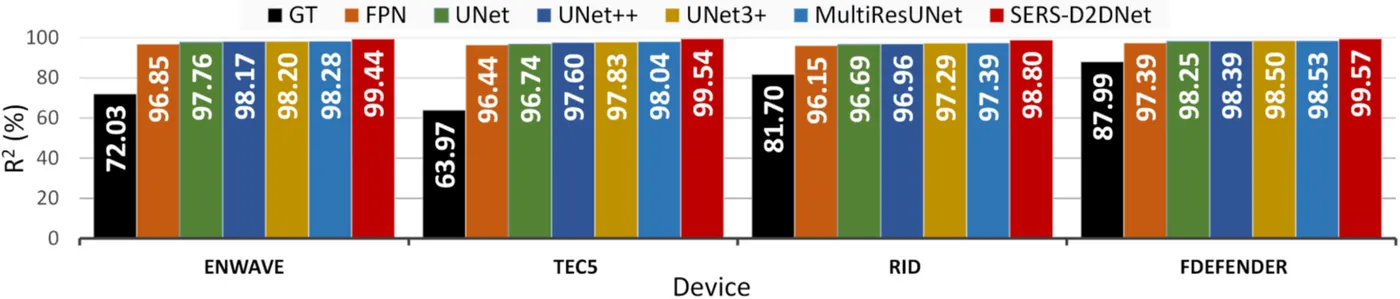
Spectra from 20 bacterial and reference analyte classes were recorded on silver nanorod substrates with four portable Raman instruments and a laboratory Renishaw reference. SERS-D2DNet, a one-dimensional sequence-to-sequence network, learned to transform portable spectra toward the reference using 50 training spectra per class.
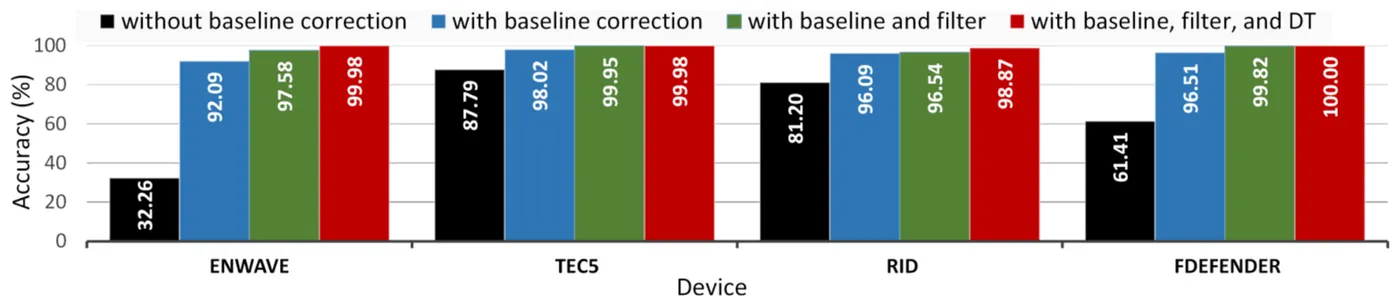
SuperRaman, a lightweight Super-ONN classifier, then identified the analyte classes before and after transformation. Agreement with the reference improved on all four instruments, and classification accuracy rose on each one. The combined framework uses 6.6 million parameters and takes 3.27 ms per inference.
- R² with the reference after transformation
- >98%
- Enwave accuracy after transformation
- 99.98%
- Analyte classes
- 20
| R² before | R² after | Accuracy before | Accuracy after | |
|---|---|---|---|---|
| Enwave | 72.03% | 99.44% | 97.58% | 99.98% |
| Tec5 | 63.97% | 99.54% | 99.95% | 99.98% |
| Rapid ID | 81.70% | 98.80% | 96.54% | 98.87% |
| First Defender | 87.99% | 99.57% | 99.82% | 100.00% |
Recognising sepsis and its causative pathogens from blood
Talanta · 2026 · Online 2025
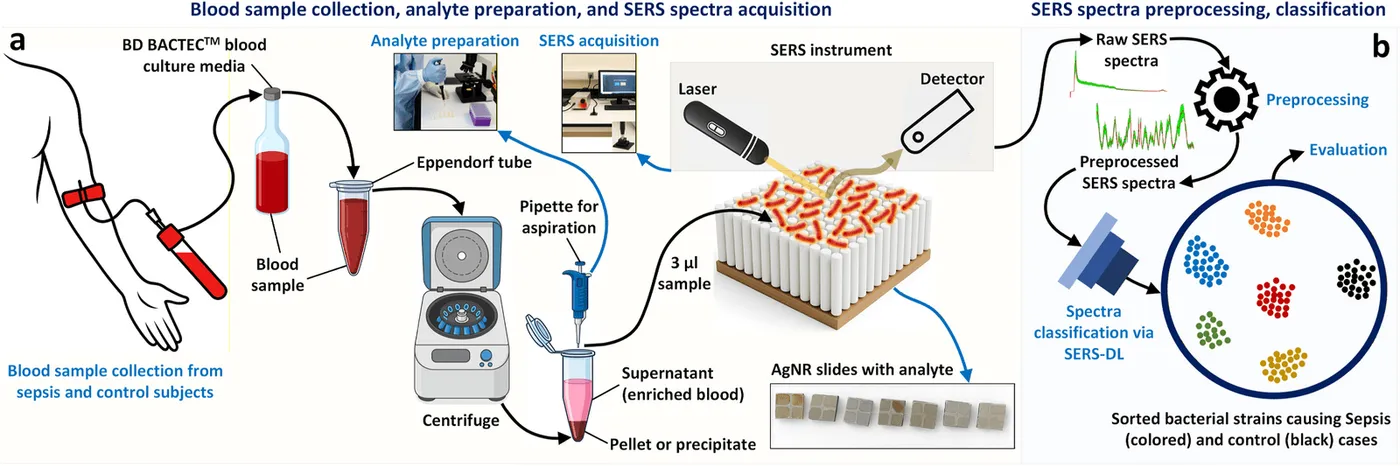
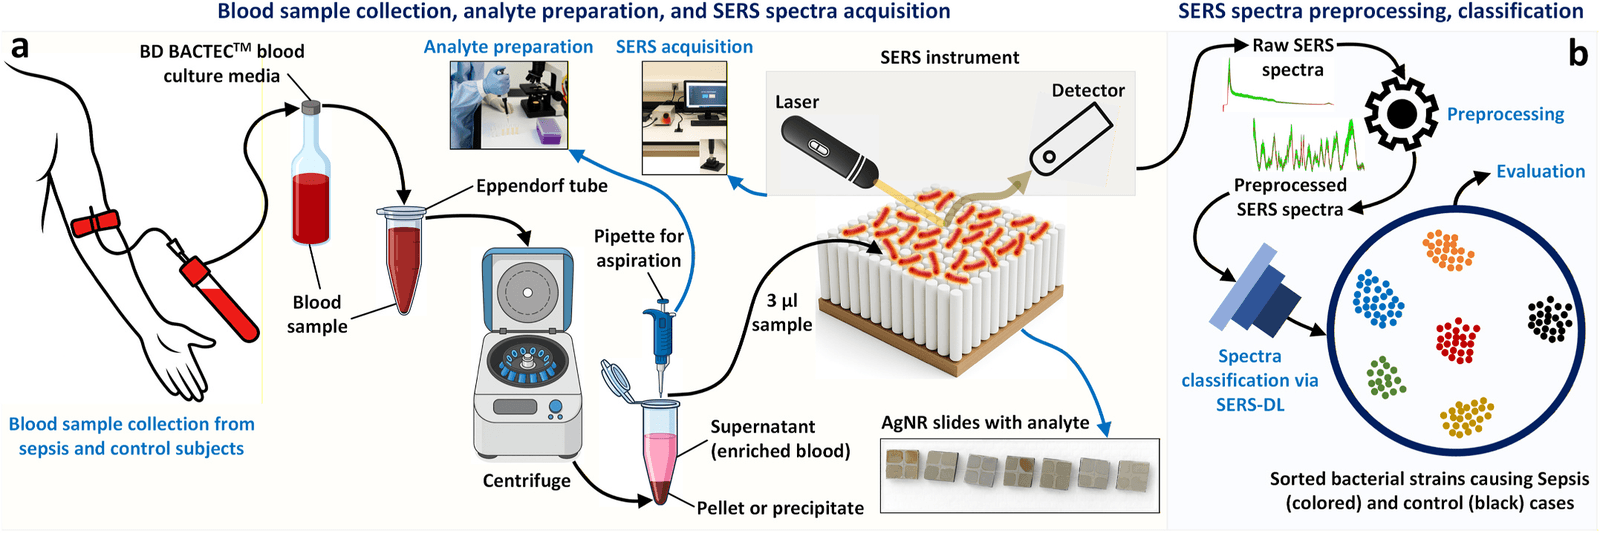
The study collected SERS spectra from 653 analyte-enriched blood samples at a tertiary hospital in Qatar, comprising 271 sepsis-positive and 382 control samples. A separate external cohort added 70 samples. The tasks were binary sepsis recognition and six-class identification of control samples and five sepsis-causing bacteria.
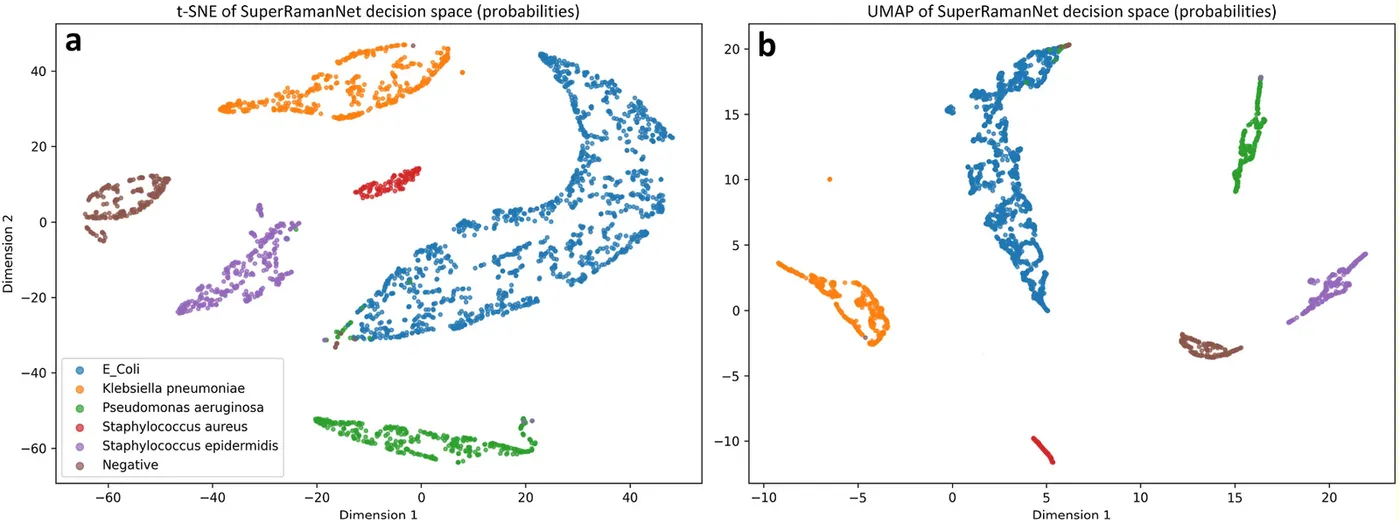
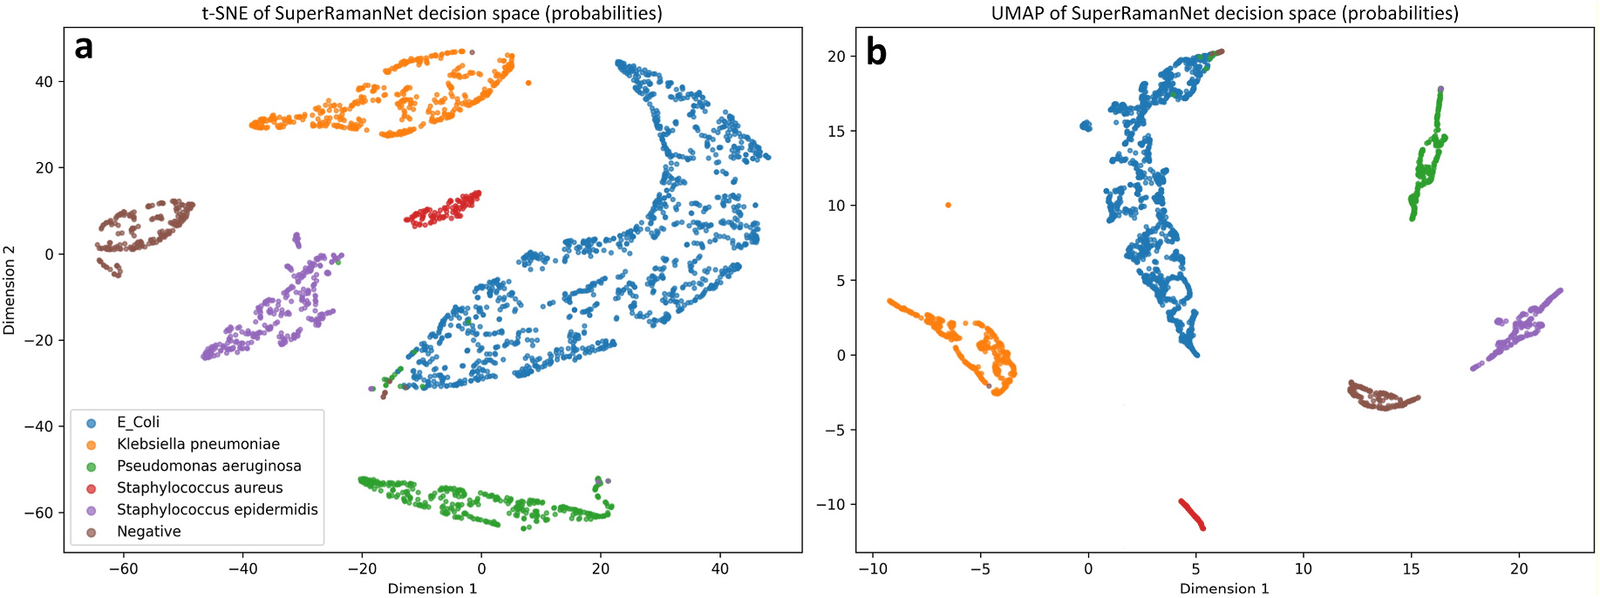
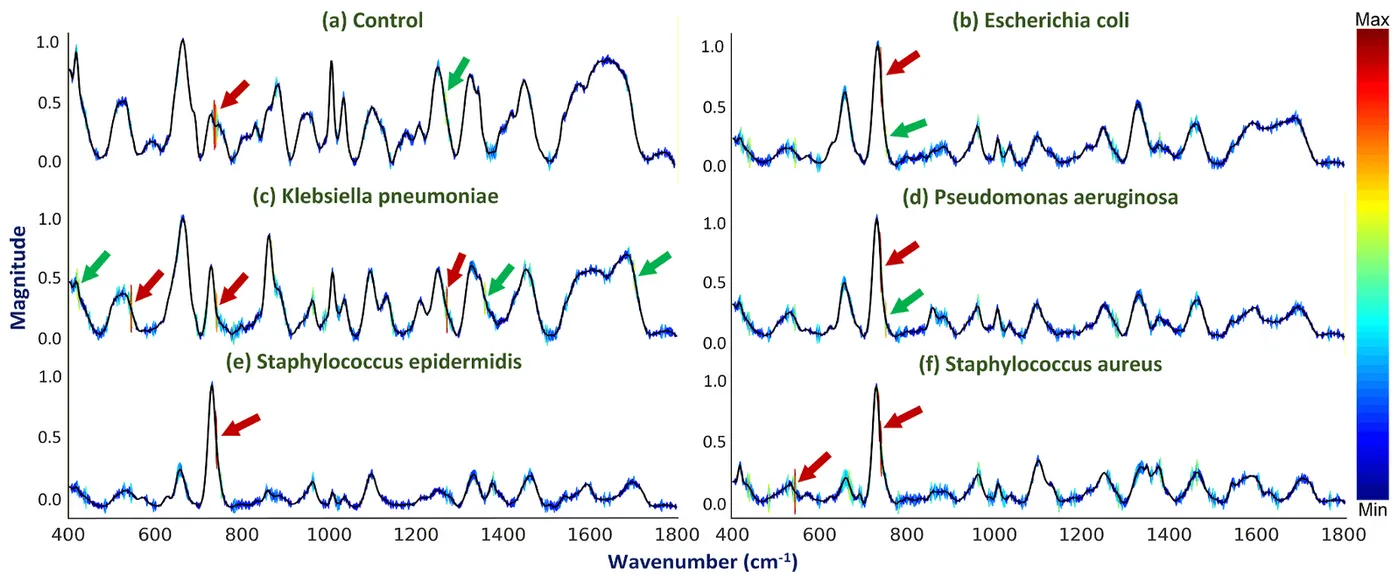
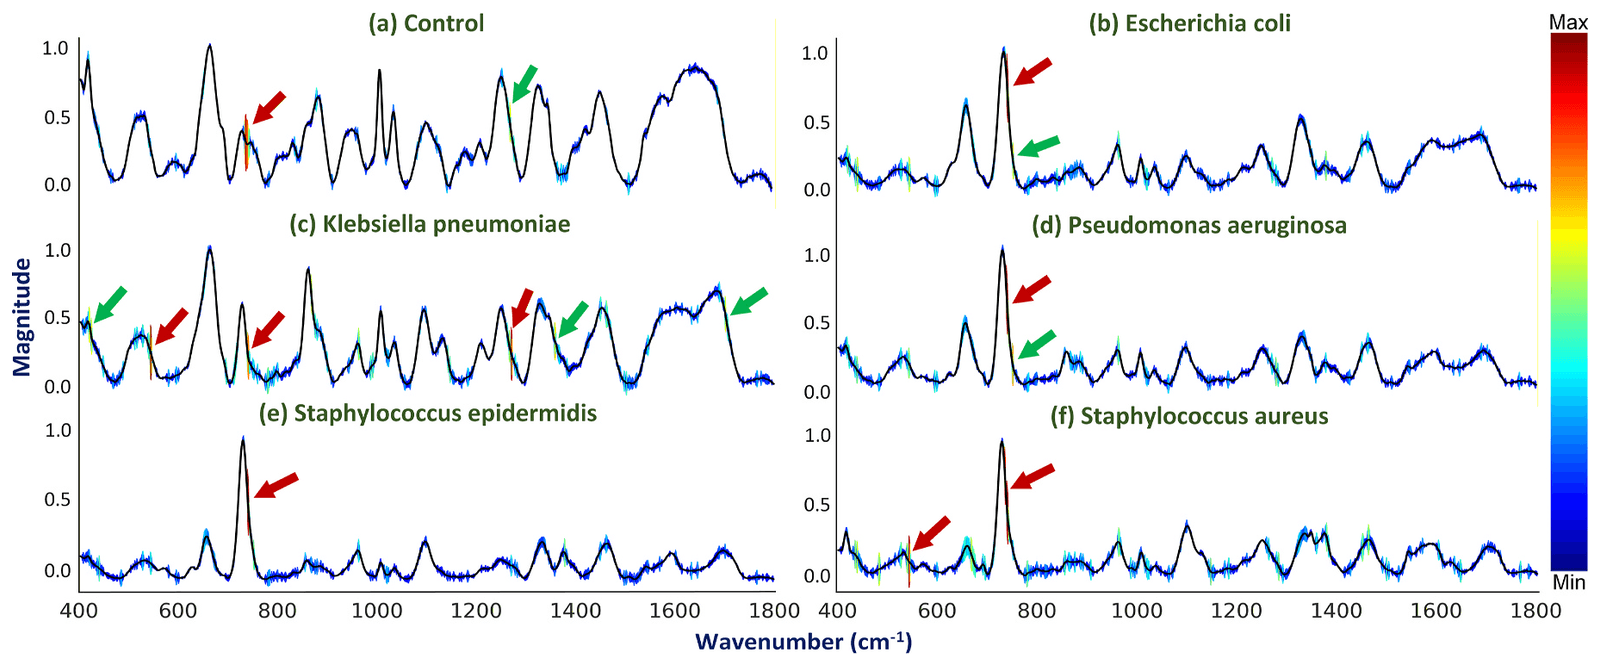
SuperRamanNet is a compact one-dimensional Super-ONN classifier with about 0.65 million parameters. Cross-validation kept all spectra from each blood sample in the same fold, and augmentation was applied only to training data. Augmentation raised external pathogen accuracy from 66.67% to 98.28%, and saliency maps highlighted the 740–760 cm⁻¹ region across classes.
- Sepsis recognition accuracy
- 99.67%
- Six-class pathogen accuracy
- 98.84%
- External pathogen accuracy
- 98.28%
| Accuracy | Precision | Recall | F1 score | Specificity | |
|---|---|---|---|---|---|
| Sepsis recognition, five-fold | 99.67% | 99.64% | 100.00% | 99.82% | 95.50% |
| Pathogen identification, five-fold | 98.84% | 98.83% | 98.83% | 98.82% | 99.05% |
| Pathogen identification, external | 98.28% | 98.31% | 98.28% | 98.26% | 99.45% |
Auditing validation across microbial SERS studies
Talanta · Online 2026
This PRISMA-guided review covered 129 experimental studies of label-free SERS with machine learning across bacterial, viral, fungal and cross-domain applications. It followed the full workflow, from target and matrix definition through sample handling, SERS platform design, spectral acquisition and preprocessing, modelling and interpretation, to validation.
The audit found that large spectral datasets often reflected repeated measurements from few biological samples. It concluded that deployable methods need biologically independent evaluation, leakage-safe preprocessing, reproducible substrates, calibration across instruments and matrices, and prospective multi-batch, multi-site validation.
- Studies reviewed
- 129
- Without biological-unit-aware validation
- 68.2%
- With external or major-domain validation
- 6.2%
| Share of studies | |
|---|---|
| Controlled-development datasets | 68.2% |
| No more than 25 independent biological units | 62.0% |
| No biological-unit-aware predictive validation | 68.2% |
| External or major-domain validation | 6.2% |
PRISM-SERS: mapping spectra for unseen analytes
Ongoing research · Manuscript in preparation
PRISM-SERS (Platform-to-Reference, class-Independent Spectral Mapping) is my current work on a harder form of cross-device standardisation. It aims to translate portable-instrument spectra into the laboratory reference domain for analyte classes the model has never seen, using unpaired data and no class labels at inference.
Each analyte class is held out in turn, with its portable and reference spectra excluded from training, validation and model selection. The full evaluation is under way, and results will be reported once the multi-fold analysis is complete.
- Spectra in the public dataset
- 29,545
- Analyte classes held out in turn
- 20
- Raman instruments
- 5
Research stages and outputs
Standardising spectra across instruments
Mapped spectra from four portable devices to a laboratory reference and tested how that affected classification across 20 analyte classes.
Sepsis and pathogen recognition from blood spectra
Developed SuperRamanNet for sepsis recognition and pathogen identification from analyte-enriched blood, with an independent external cohort.
Evaluating validation practices in the literature
Reviewed 129 studies for biological independence, external evaluation and reporting across the workflow from sample preparation to modelling.
PRISM-SERS and transfer to unseen analytes
Developing class-independent spectral mapping for analytes held out of training. A manuscript is in preparation, and a second workstream studies few-shot recognition.
My contribution
I led the cross-device study, including model development, experiments, generalisation analysis, visualisation and manuscript preparation. For the sepsis study, I developed the deep learning pipeline from raw spectra through preprocessing, data splitting, training, evaluation and interpretation. I also led the design, corpus audit and synthesis of the 129-study review, and I am developing PRISM-SERS.
Scope and validation
The cross-device study and PRISM-SERS use prepared analytes rather than clinical specimens. The sepsis study drew its primary samples from one hospital and tested a 70-sample external cohort, so prospective multi-site validation is still needed. The review percentages describe the 129 studies in its corpus, and PRISM-SERS has no published results yet.
Next steps
Complete the multi-fold PRISM-SERS evaluation and prepare the manuscript for submission.
Publications
- Deep learning-based cross-device standardization of surface-enhanced Raman spectroscopy for enhanced bacterial recognitionSpectrochimica Acta Part A: Molecular and Biomolecular Spectroscopy · 2026
- SERS on analyte-enriched blood for rapid, culture-free sepsis recognition and causative pathogen identification with super operational neural networksTalanta · 2026
- Machine learning-enabled label-free SERS for microbial sensing: Toward robust, generalizable, and deployable workflowsTalanta · 2027 (online 2026)
Code
- SERS-D2DNet-SuperRamanResearch software and repository details
Data
- Multi-Instrument SERS DatasetZenodo dataset