Spectroscopic sensing · 2026
Cross-device Raman spectroscopy
Aligning spectra from portable Raman instruments to a laboratory reference for bacterial analyte classification.
Qatar University · Qatar National Research Fund-supported bacterial diagnostics research
Approach
Can spectra recorded on different instruments support more consistent recognition of the same analyte classes?
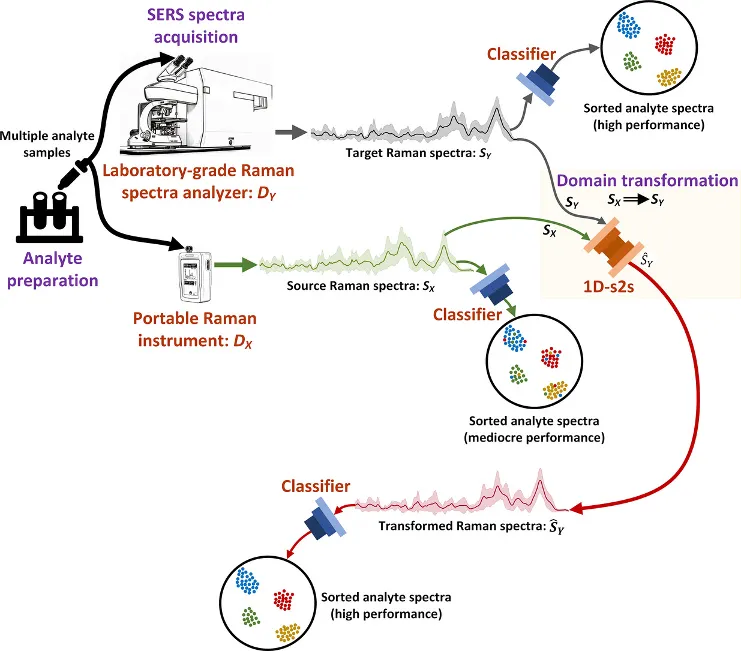
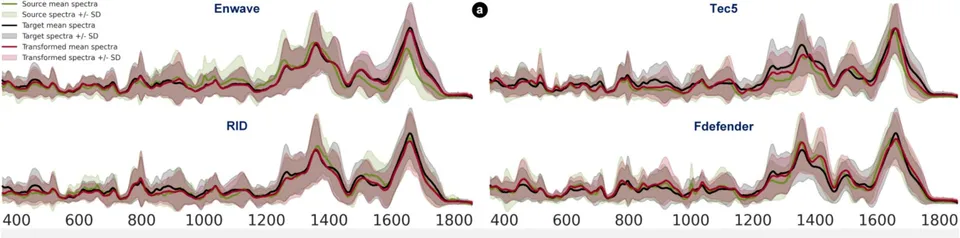
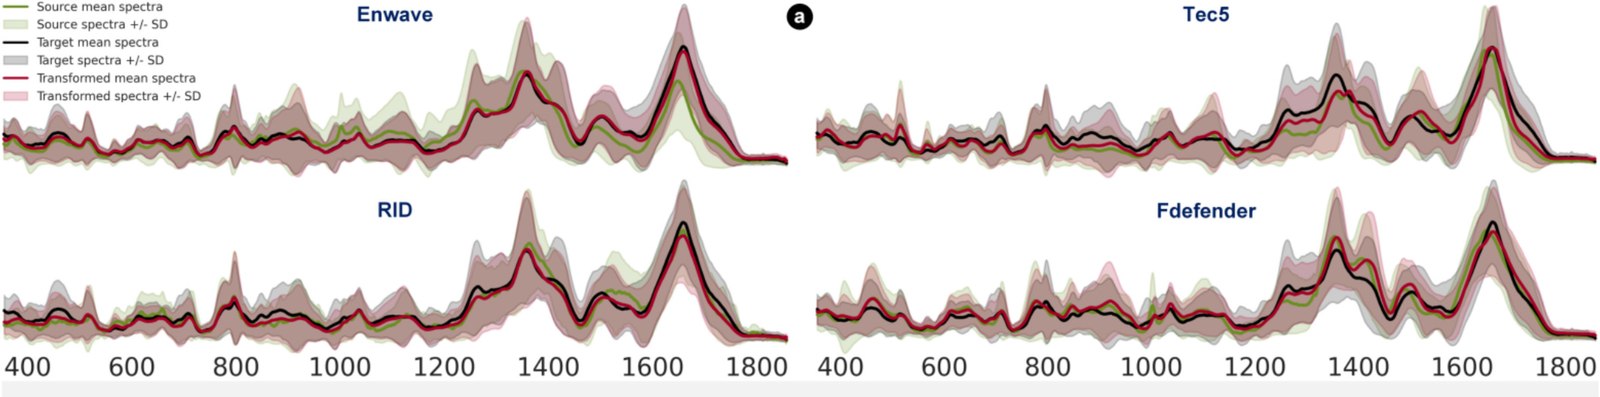
SERS-D2DNet transforms spectra from four portable devices toward a Renishaw reference. The study then uses SuperRaman to classify the original and transformed spectra across 20 analyte classes, using 50 spectra per class to train the classifiers.
- Record spectra on five instruments
- Transform portable spectra with SERS-D2DNet
- Classify with SuperRaman
Reported results
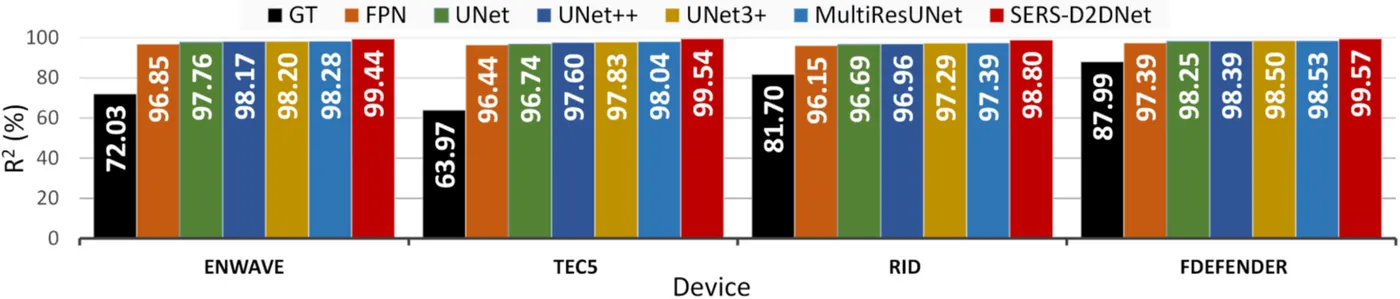
Classification accuracy increased after transformation for all four portable devices, with the largest gains for Enwave and Rapid ID. The transformed spectra also matched the reference more closely than the outputs of five benchmark sequence-to-sequence models, with R² between 98.80% and 99.57%.
- Enwave accuracy
- 97.58% → 99.98%
- Rapid ID accuracy
- 96.54% → 98.87%
My contribution
I led the modelling and evaluation of the spectral transformation and recognition workflow, including implementation, generalization analysis, visualization, and writing.
Study scope
The study used prepared analytes across five instruments, including the laboratory reference. The reported comparisons apply to those samples and acquisition conditions. The Zenodo record explains how to request the restricted files.
Publications
- Deep learning-based cross-device standardization of surface-enhanced Raman spectroscopy for enhanced bacterial recognitionSpectrochimica Acta Part A: Molecular and Biomolecular Spectroscopy · 2026
Code
The recovered translator has 61.5 million parameters. The paper reports 6.15 million. The synthetic CPU demo exercises four small translators and a classifier. Reproducing the reported results requires matching the published architecture and evaluation protocol. Paper-trained weights are unavailable.
- SERS-D2DNet-SuperRamanResearch software and repository details
Data
- Multi-Instrument SERS DatasetZenodo dataset