Wearable biomechanics · 2025
Reconstructing 3D kinetics from smart-insole loading
Estimating 3D forces, moments, and centre of pressure from the vertical loads measured by smart insoles.
Qatar University · Pressure-only baseline for the AI-powered smart-insole project
Approach
How much of the force and moment profile measured by an instrumented treadmill can be recovered from insole signals?
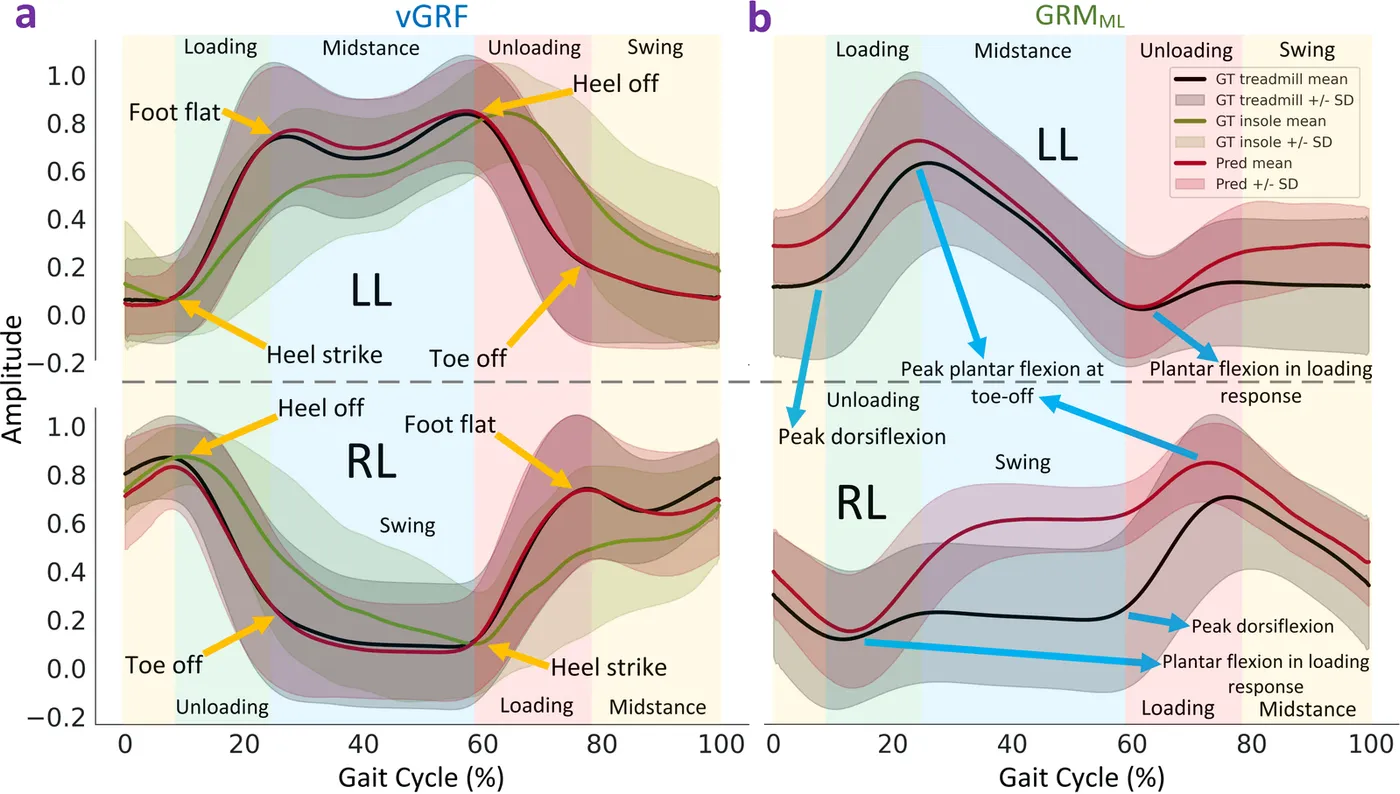
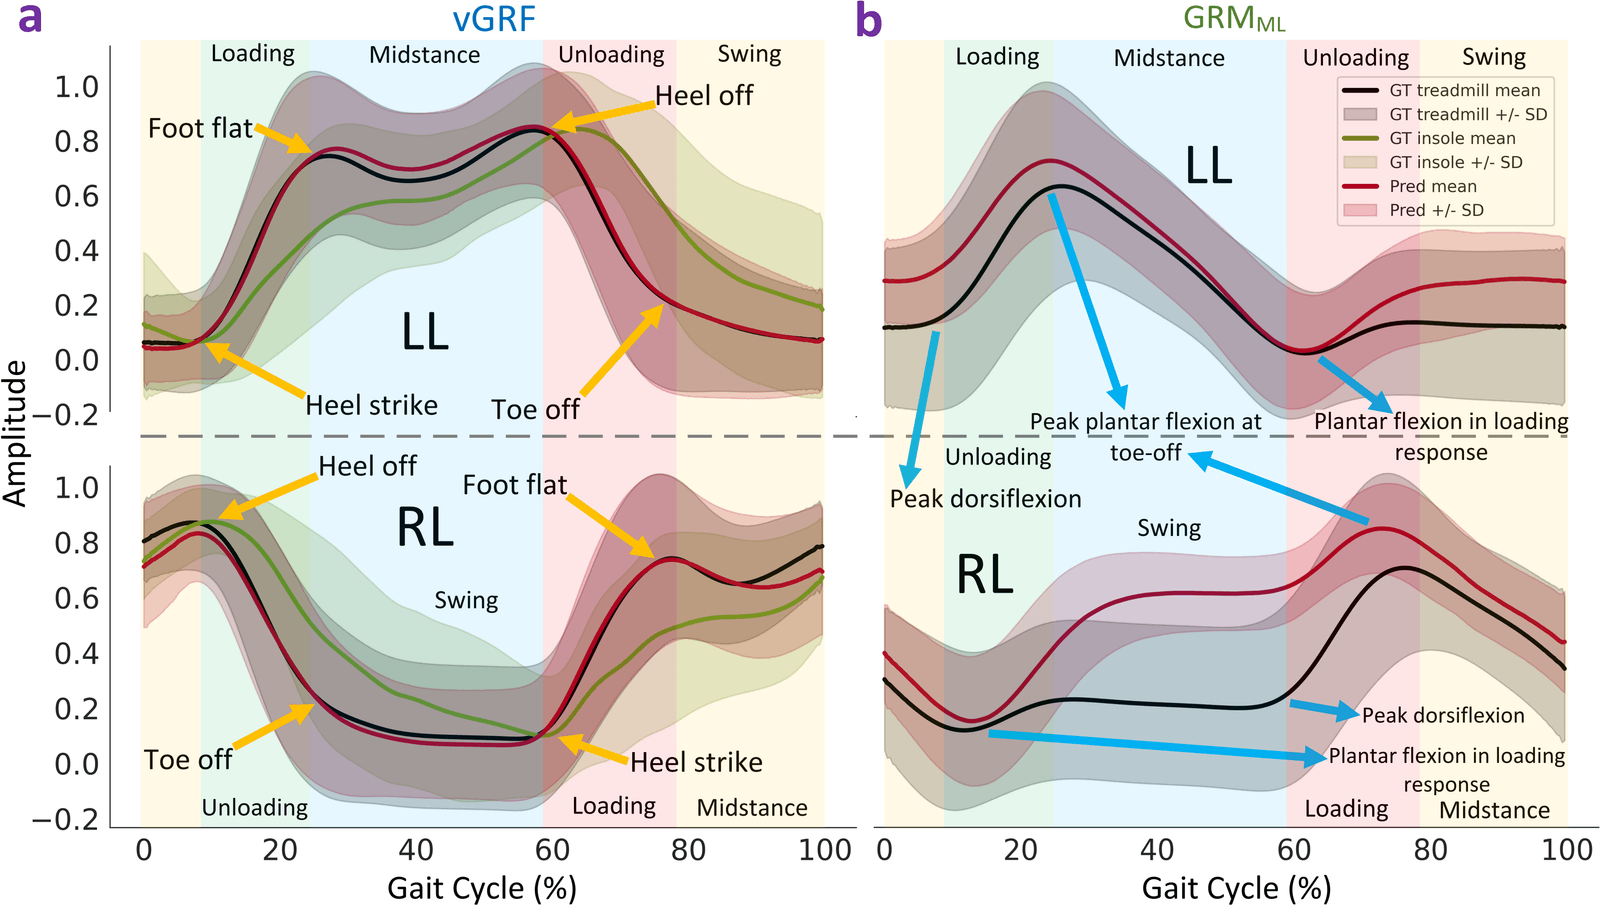
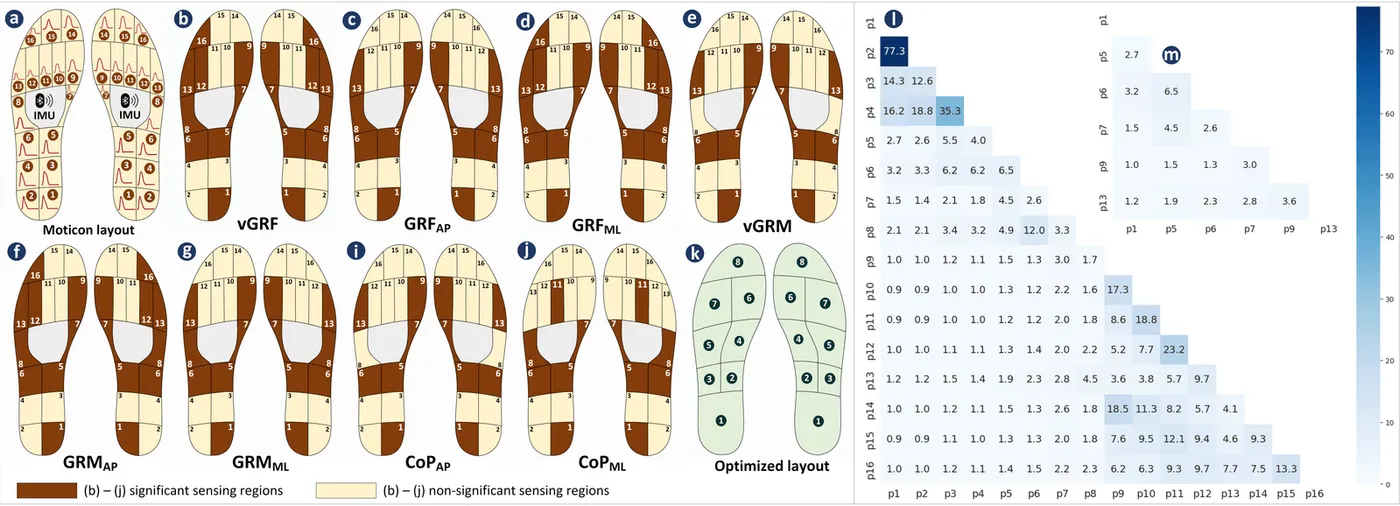
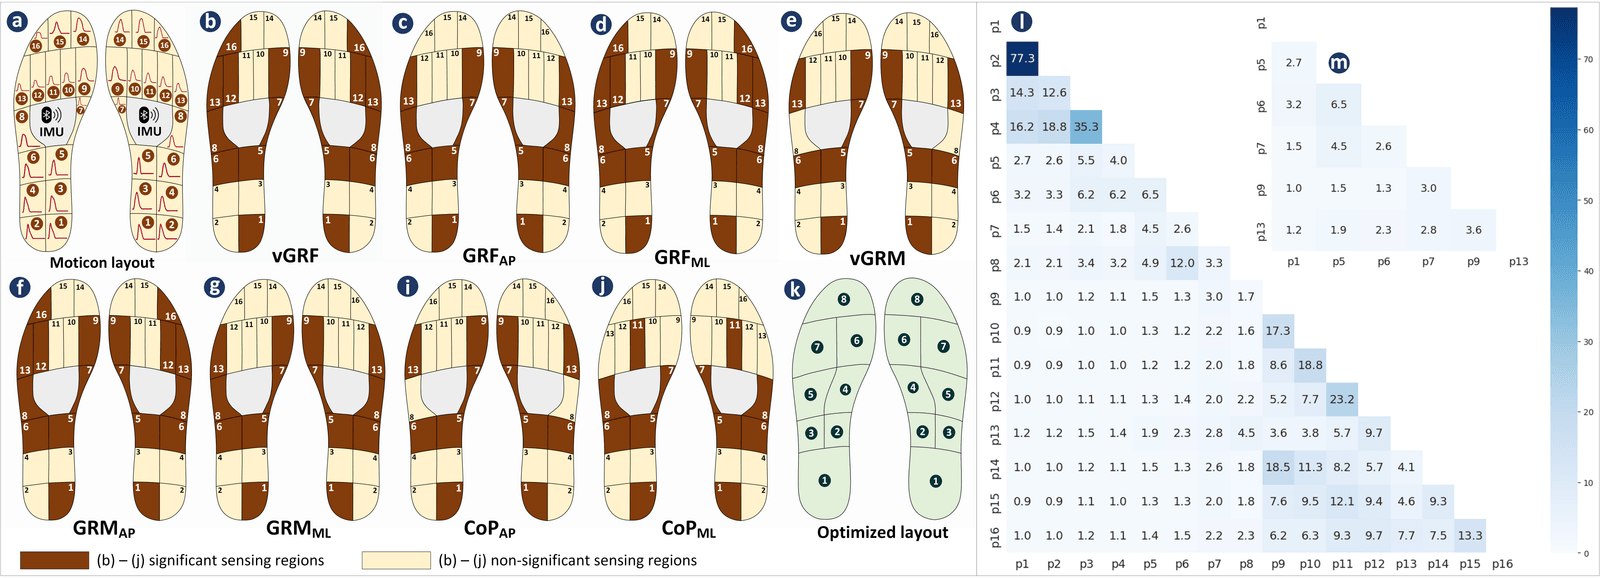
Ke2KeNet maps the 16 vertical-loading channels of each Moticon insole to eight treadmill-referenced waveforms per foot: three forces, three moments, and the anterior–posterior and mediolateral centre of pressure. Separate one-dimensional models were trained for each output and compared with instrumented-treadmill recordings across walking and running speeds. A sensor-relevance analysis then tested whether all 16 pressure channels were needed.
- Smart-insole pressure signals
- Estimated forces, moments and centre of pressure
- Comparison with treadmill measurements
Reported results
For the average gait cycles, Pearson correlation exceeded 0.95 for every output except the right-foot vertical moment, and the estimated vertical force was closer to the treadmill than the summed insole channels. Reducing the layout from 16 to eight pressure locations per foot gave broadly comparable accuracy.
- Average-cycle correlation, all outputs but one
- > 0.95
- Pressure sensors per foot after layout analysis
- 16 → 8
- Healthy participants, five subject-independent folds
- 9
My contribution
I led preprocessing, model development, subject- and speed-wise evaluation, analysis, and manuscript preparation.
Study scope
The results come from nine healthy participants under controlled treadmill conditions. Performance varied across participants and speeds, particularly for some moments.
Ongoing work
This study is the foundation of the AI-powered smart-insole project, which now combines plantar loading with wearable motion, tests transfer across devices and develops the insole hardware. The project overview sets out each stage.
Run the insole workflow
Use Python 3.12 and the tagged code release v0.1.0. The demo uses a small U-Net and synthetic signals to exercise the insole workflow on CPU without study data or pretrained weights.
Get the release
git clone --branch v0.1.0 --single-branch https://github.com/Sakib1263/Unimodal-3D-Kinetics-Estimation-from-Insole-or-IMU.git
cd Unimodal-3D-Kinetics-Estimation-from-Insole-or-IMU
Install and run the demo
Create an environment with
python -m venv .venv. Activate it withsource .venv/bin/activateon Linux or macOS, or.\.venv\Scripts\Activate.ps1in PowerShell. Then run the following commands.python -m pip install -r requirements.txt python -m kinetics demo --config configs/insole.jsonCheck the output
The command prints
Saved run: …/runs/demo_Fy_LL_UNet_…. Open that directory and check thatstatus.jsonreports"status": "complete". The run also writessummary.jsonand fold-level predictions. Those results describe synthetic inputs.
Verified on CPU. A fresh checkout of v0.1.0 completed the synthetic fold and produced finite reference and prediction arrays. The demo verification record lists the tested versions, completion status, and expected array shape.
Work with the study data
Huawei Wang’s processed treadmill and insole recordings are publicly downloadable. Use the data preparation guide to create the expected input files. To reproduce the article evaluation, match the preprocessing, target scaling and participant folds described in the study.
python -m kinetics inspect --config configs/insole.jsonThe article’s training-ready exports and pretrained checkpoints are separate from the release. The verification record covers synthetic inputs only.
Publications
- 3D Foot Kinetics Estimation From Distributed VGRF From Smart Insoles via 1D Domain TransformationIEEE Journal of Biomedical and Health Informatics · 2026 (online 2025)
Code
- Unimodal-3D-Kinetics-Estimation-from-Insole-or-IMUResearch software and repository details