Wearable biomechanics · 2023–present
AI-powered smart insoles for 3D gait kinetics
Reconstructing 3D forces, moments, and centre of pressure from smart-insole loading and wearable motion sensors.
Published feasibility studies and a Qatar University Collaborative Grant begun in March 2026
Approach
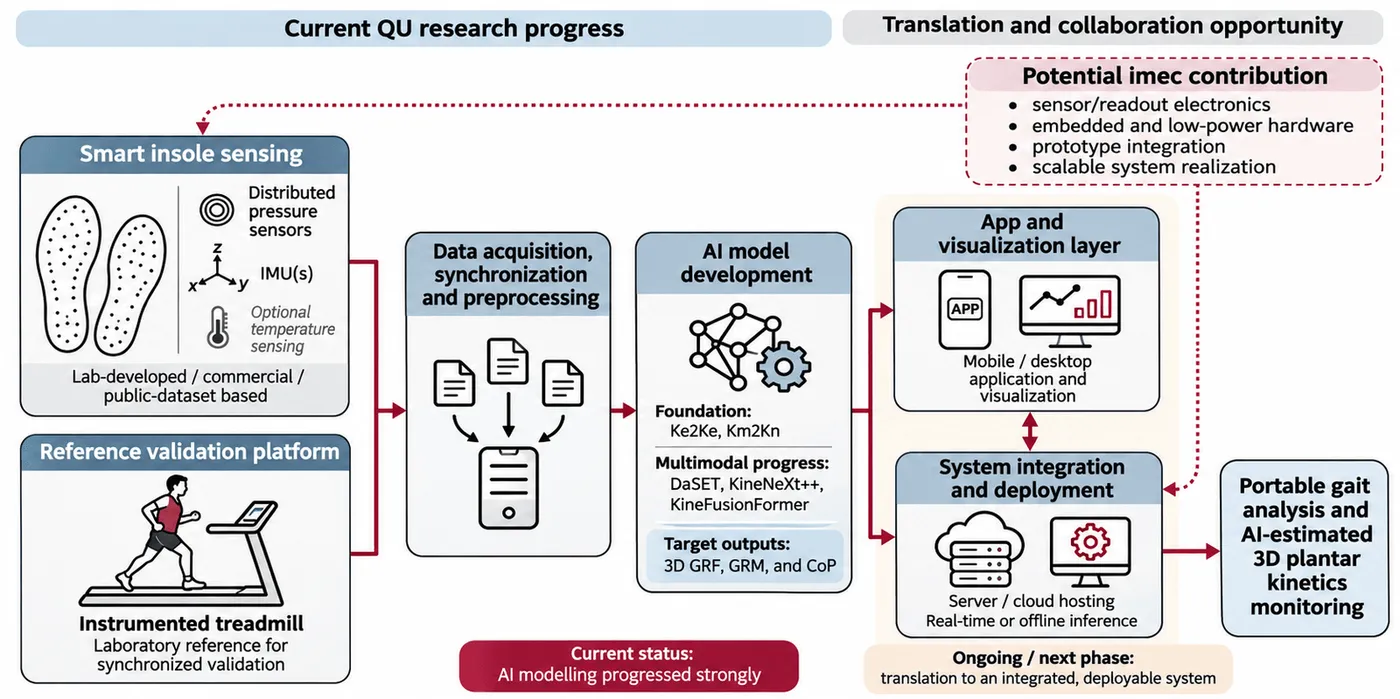
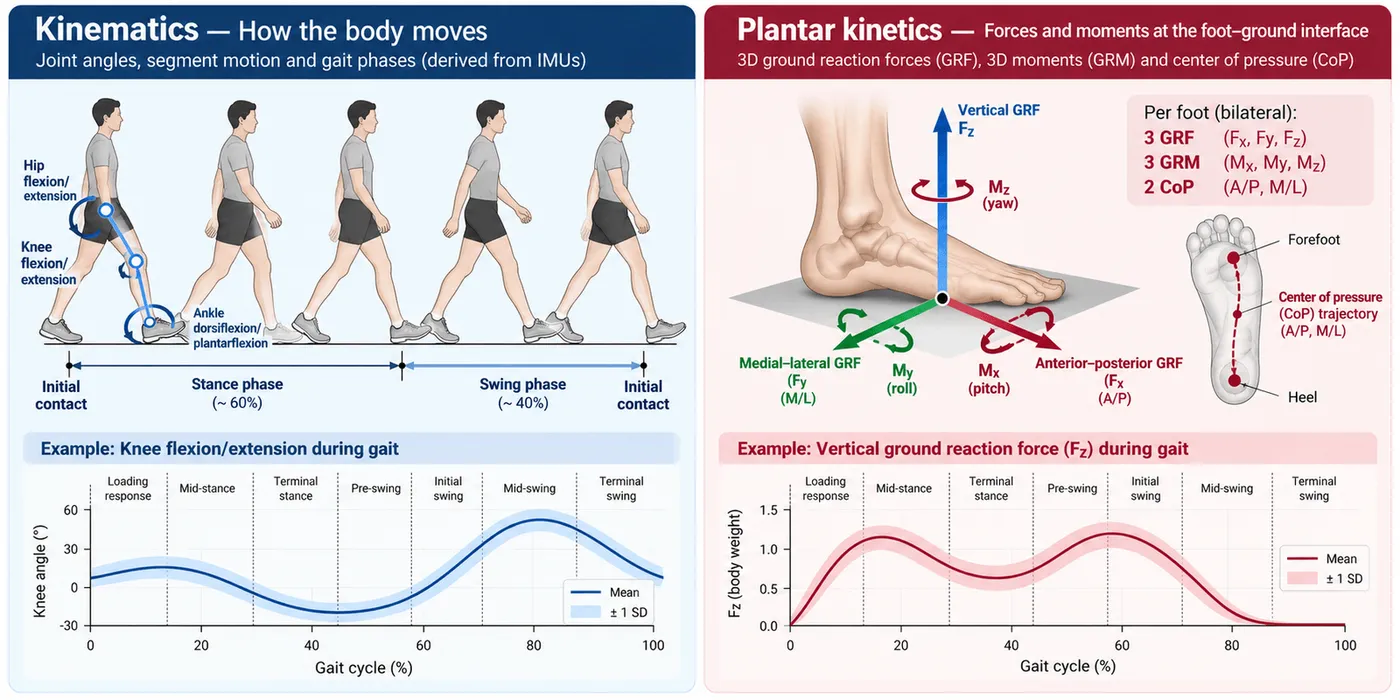
Instrumented treadmills measure the full set of foot–ground kinetics but are fixed and expensive, while smart insoles are portable but mainly record vertical loading. The project trains one-dimensional sequence-reconstruction models that estimate, for each foot, three ground reaction forces, three moments, and the anterior–posterior and mediolateral centre of pressure, which gives 16 waveforms for both feet. The inputs are insole pressure, wearable motion, or both. Every model is evaluated against instrumented-treadmill references with the test participants held out of training. Alongside the modelling, the team is developing the insole hardware and the application that will run the models. The sections below follow the project in order.
- Insole pressure and wearable motion
- Reconstruct 16 kinetic waveforms
- Compare with instrumented-treadmill references
Foundation: smart-insole loading to 3D kinetics
Published · IEEE Journal of Biomedical and Health Informatics, 2026
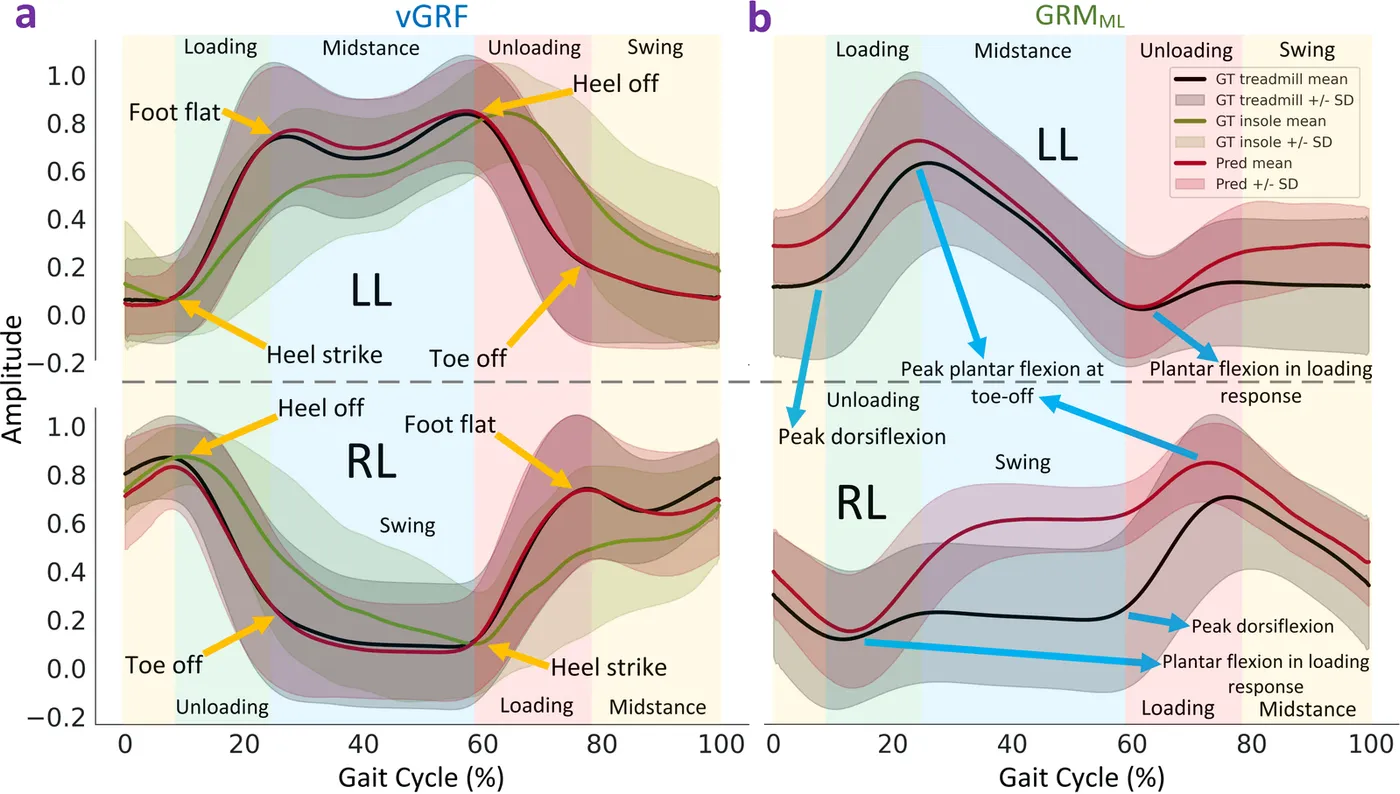
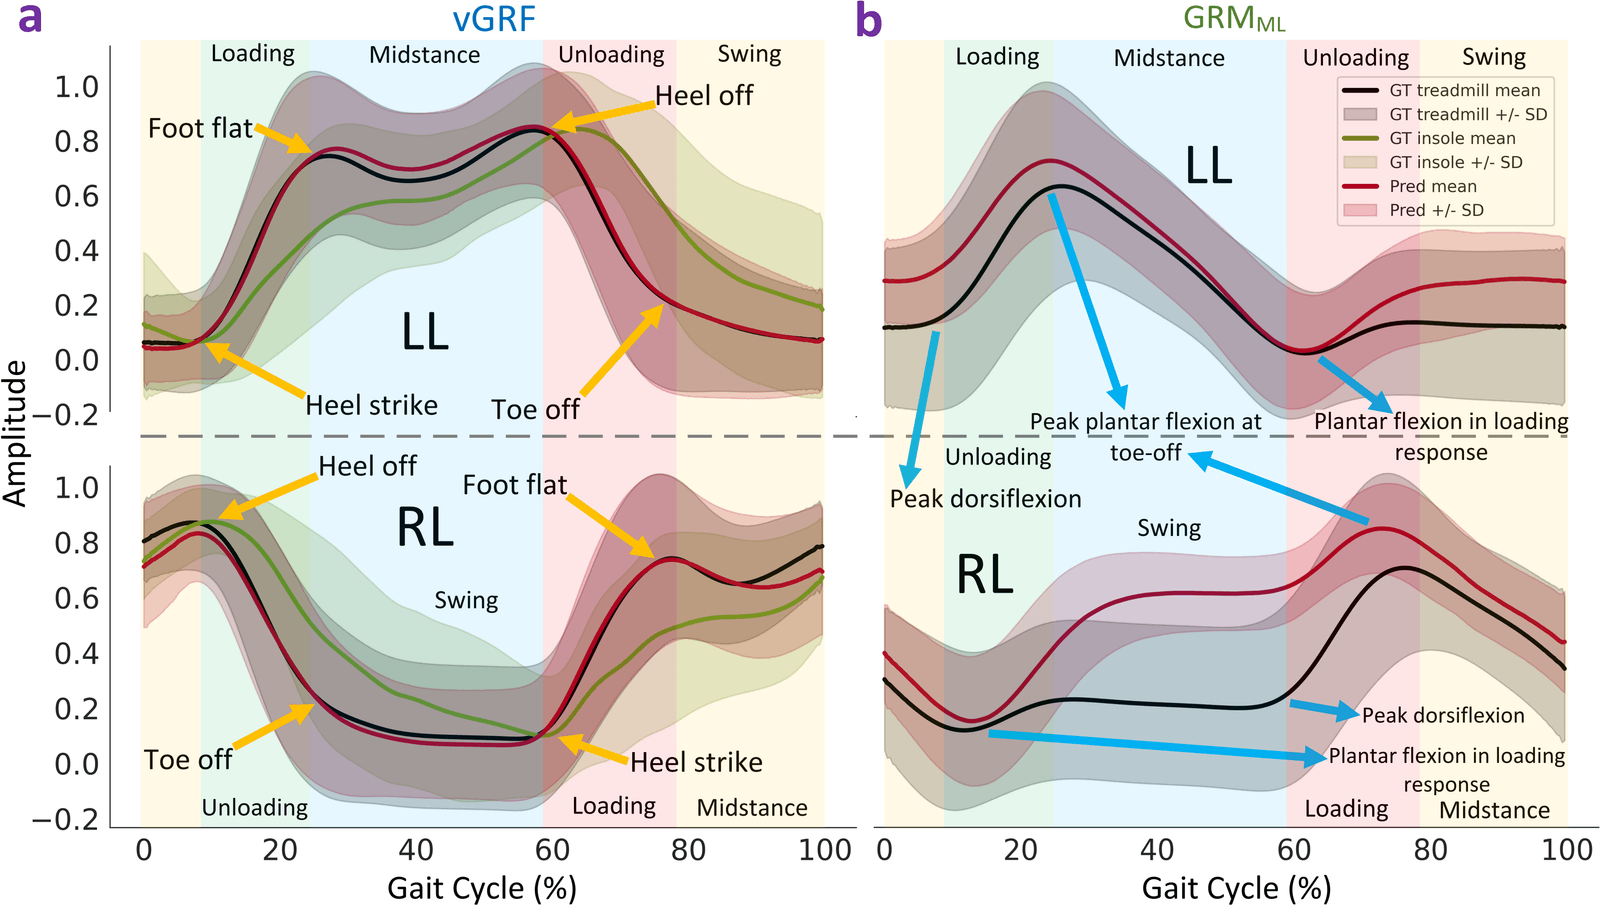
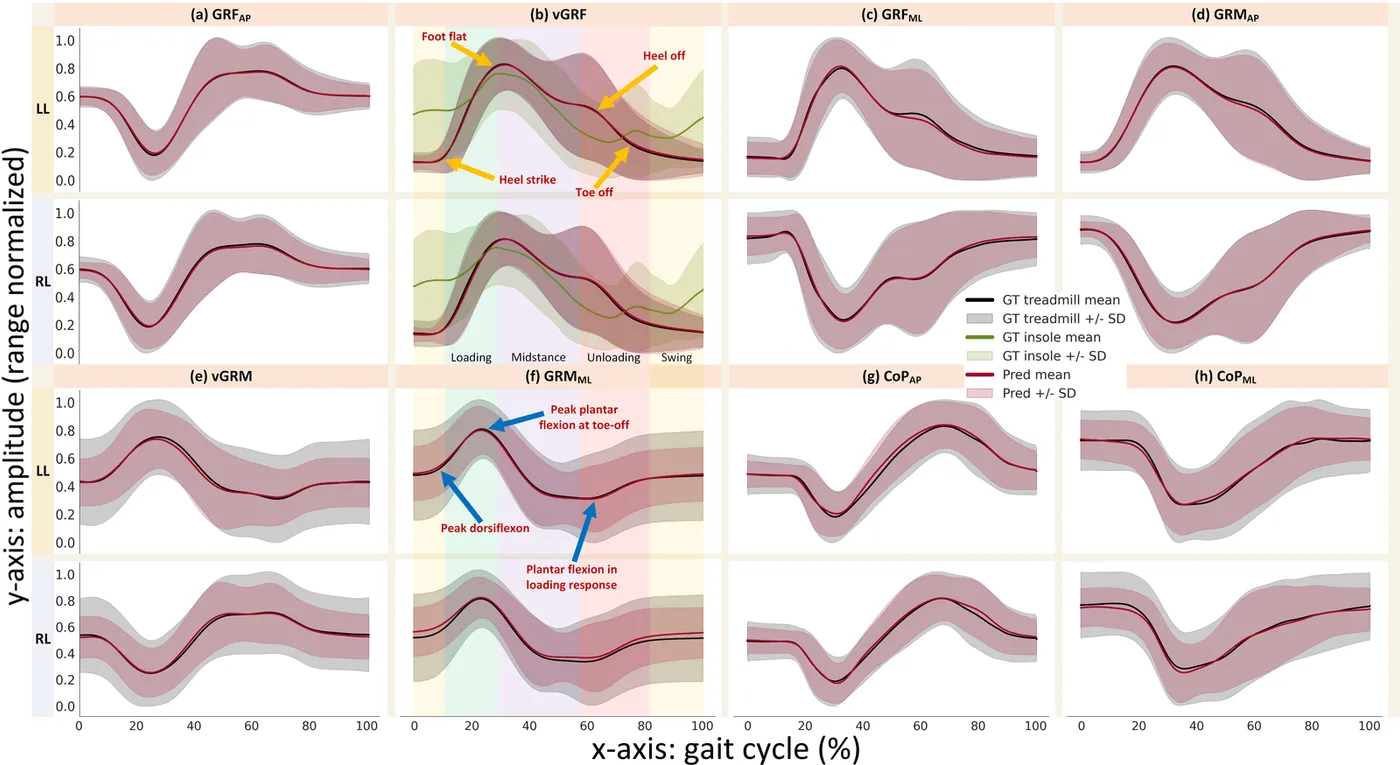
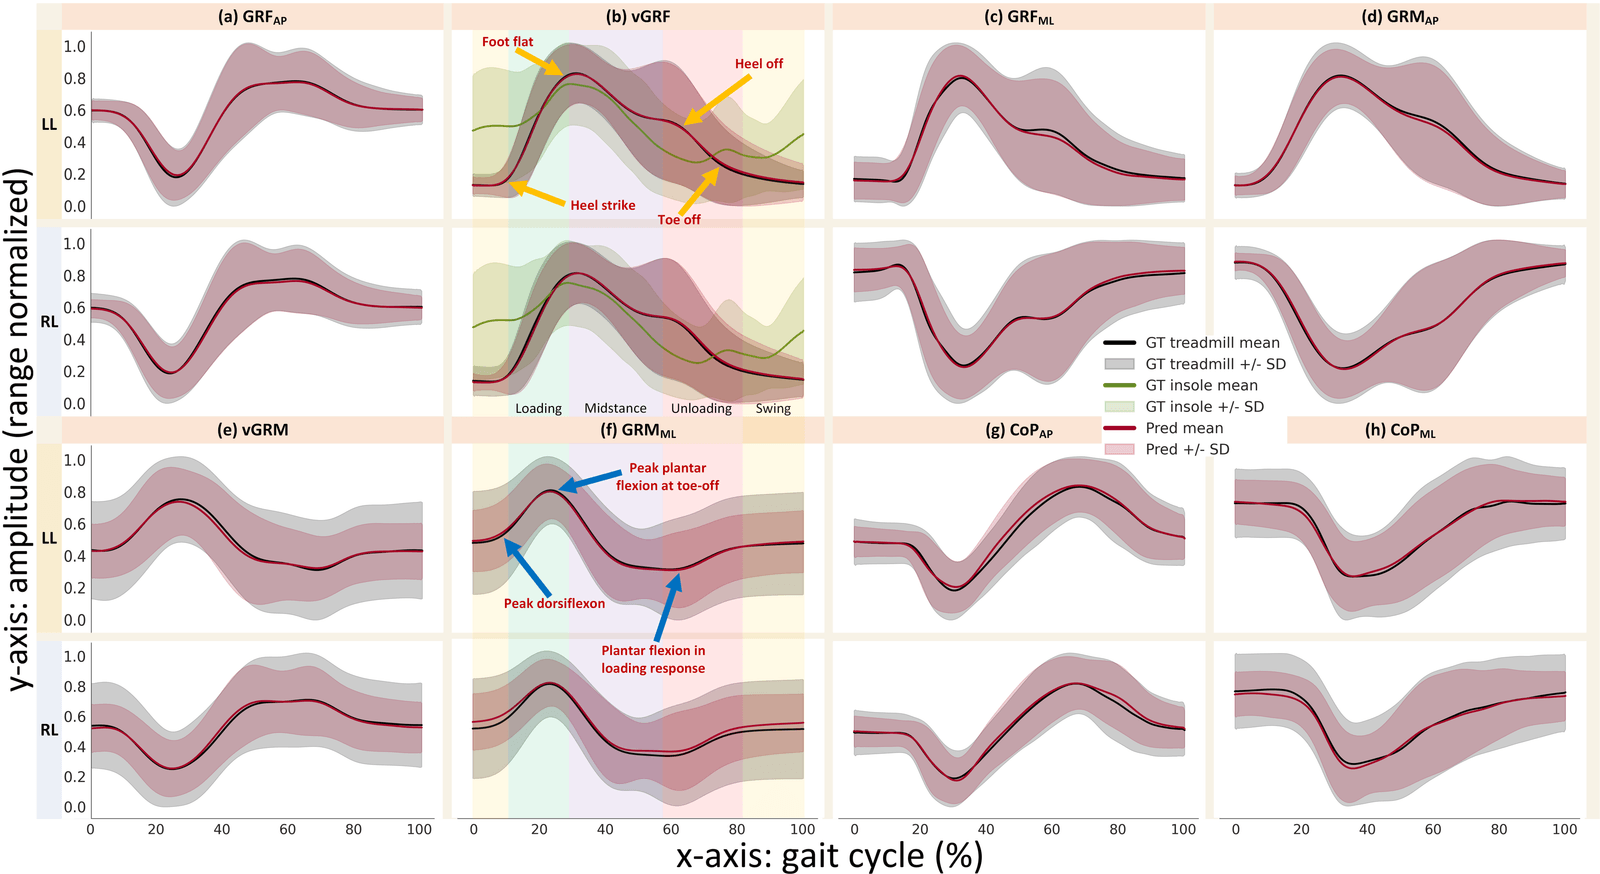
Ke2KeNet maps the 16 vertical-loading channels of each Moticon insole to eight treadmill-referenced waveforms per foot. Separate one-dimensional models were trained for each output and evaluated with five subject-independent folds on nine healthy participants walking and running on an instrumented treadmill.
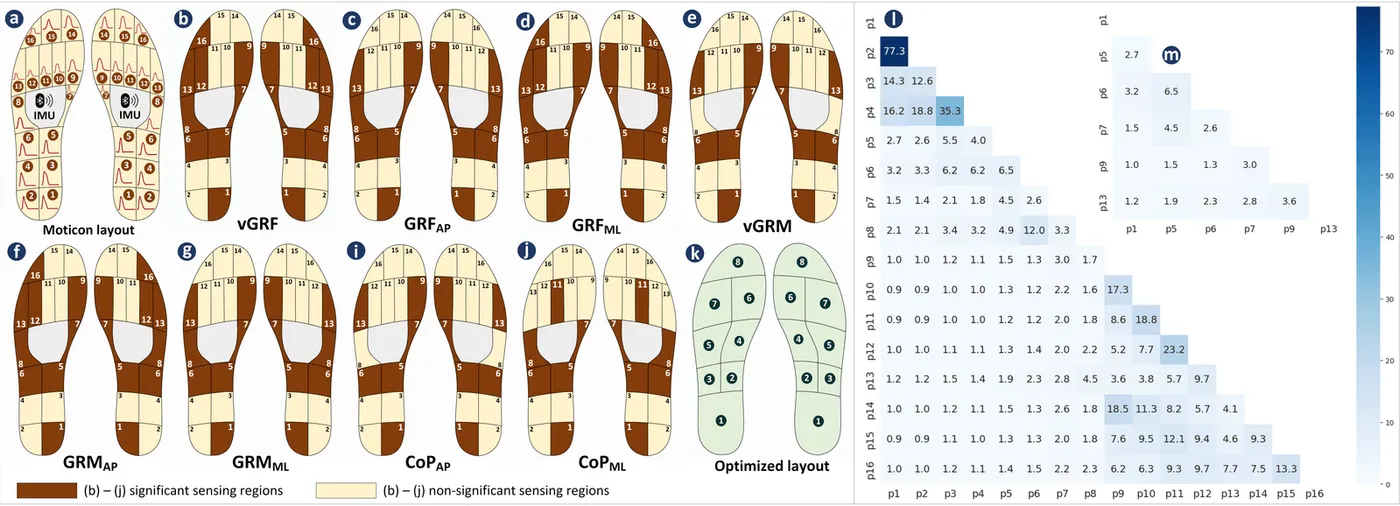
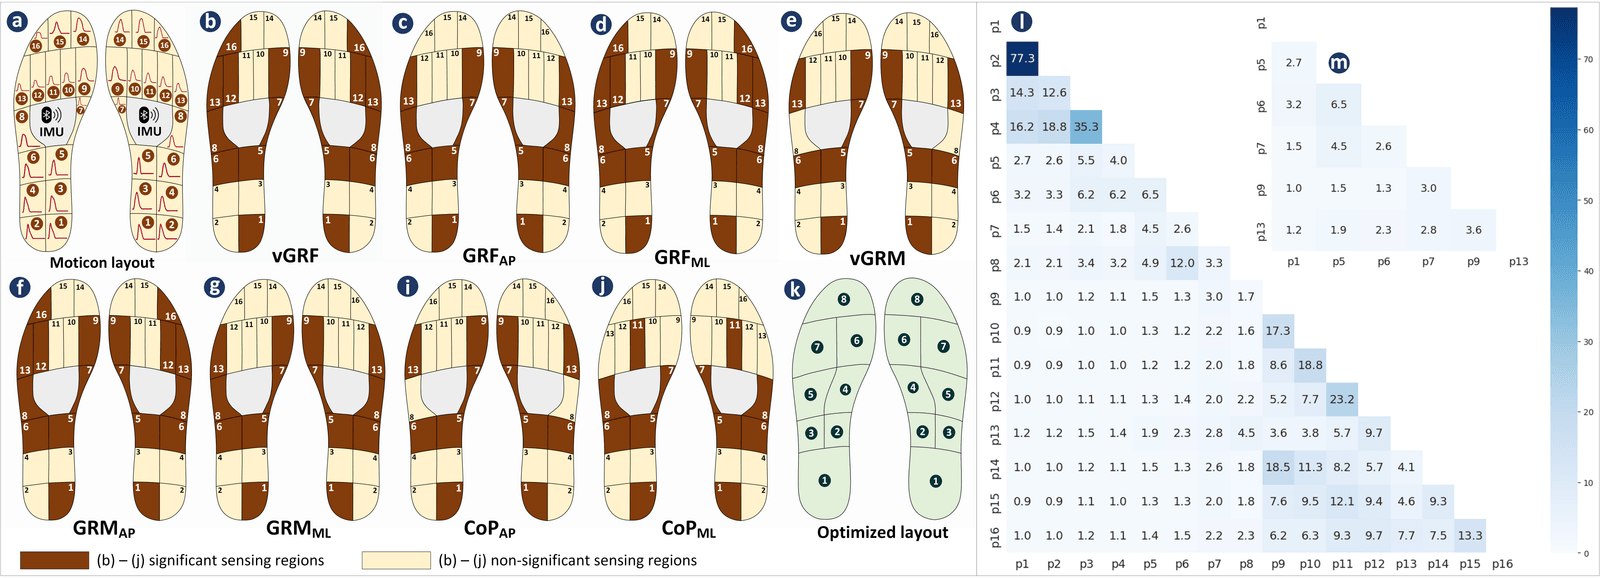
For the average gait cycles, Pearson correlation exceeded 0.95 for every output except the right-foot vertical moment, and the estimated vertical force was closer to the treadmill than the summed insole channels. A sensor-relevance analysis then reduced the layout from 16 to eight pressure locations per foot with broadly comparable accuracy, which now guides the prototype layout.
- Average-cycle correlation, all outputs but one
- > 0.95
- Pressure sensors per foot after layout analysis
- 16 → 8
- Healthy participants, five subject-independent folds
- 9
Harmonising two public gait datasets
Completed · 2026
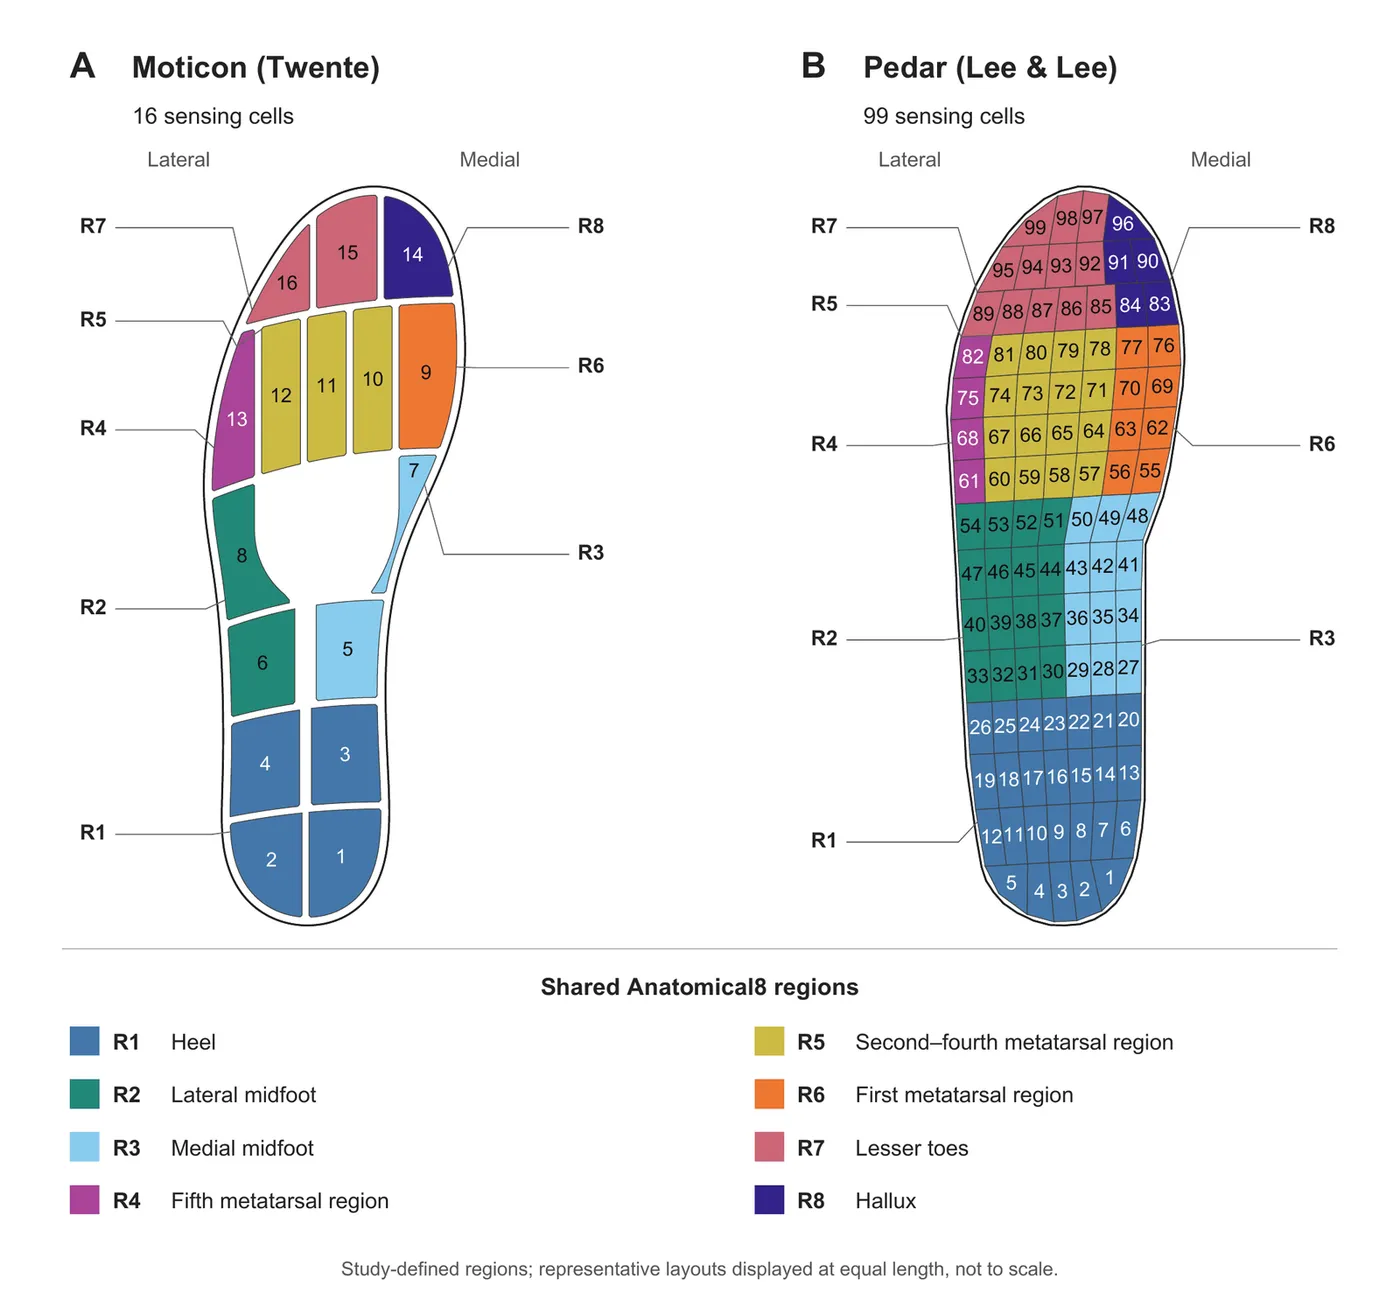
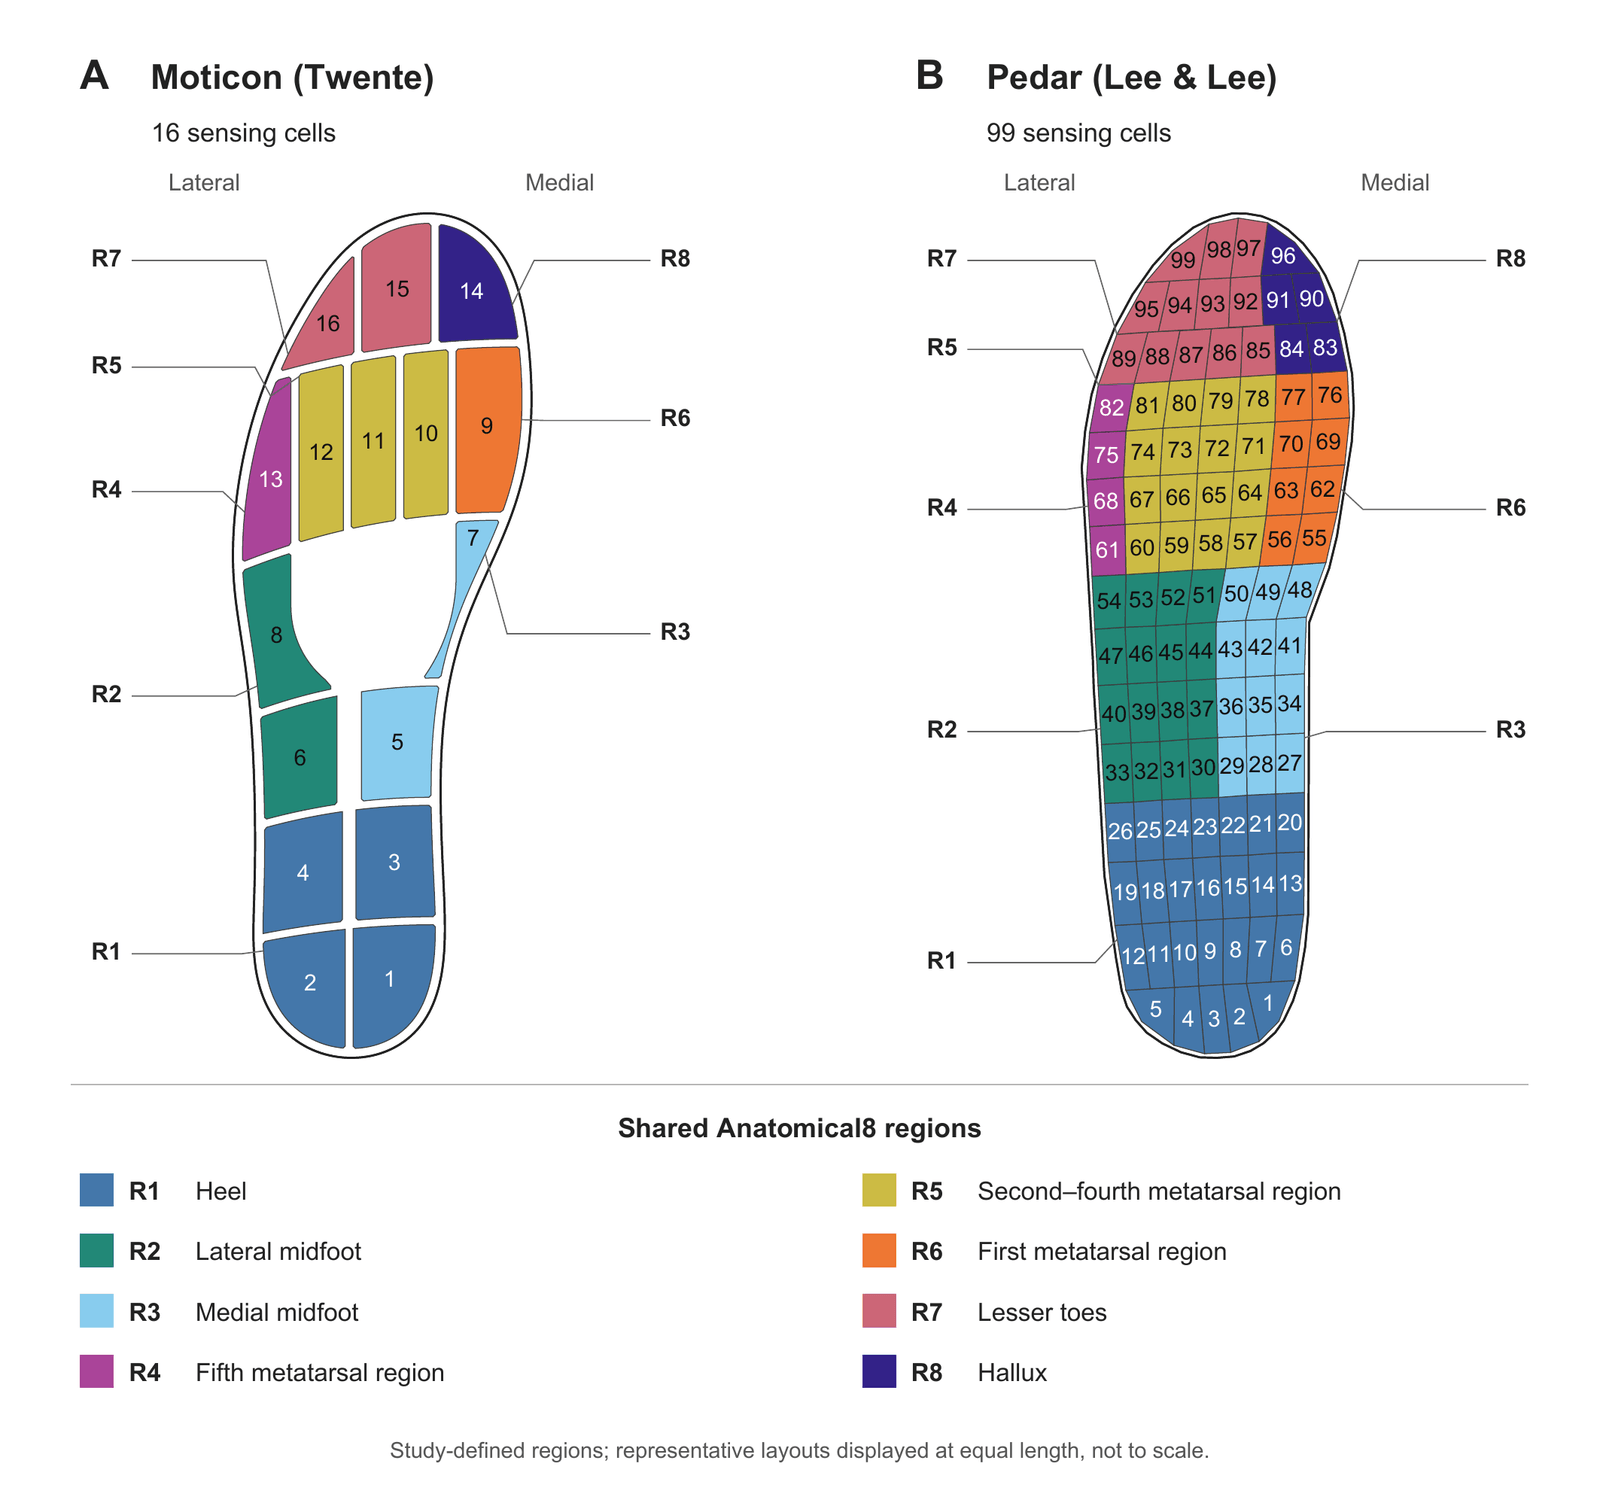
The funded phase began by bringing two public gait datasets into one format. The University of Twente recordings are used for model development with participants held out. They cover nine adults with 16-cell Moticon insoles, eight Xsens IMUs and a Motek split-belt treadmill. The independent Lee and Lee dataset tests transfer to different equipment and protocols, with 12 adults, 99-cell Pedar insoles, 17 Xsens IMUs and an AMTI treadmill.
Both datasets were filtered, resampled to 256 Hz and cut into four-second windows. The source participant, trial and signal validity are recorded for every window.
Kinematics only: which body motion carries the kinetics?
Manuscript under revision
Km2Kn asked how much of the foot kinetics wearable motion capture can recover on its own, and which body region matters most. Of the pelvis, lumbar, hip, knee and ankle trajectories, the six bilateral ankle angles gave the best balance of accuracy and compactness. Using all 25 trajectories did not help consistently.
With those six channels, Km2KnNet reached a mean correlation of 98.21% across the eight outputs on held-out participants. That was the highest of the six architectures compared. Removing its full-scale feature fusion caused the largest drop in the ablation study.
- Mean gait-cycle correlation across eight outputs
- 98.21%
- Motion channels needed: bilateral ankle angles
- 6 of 25
Does combining pressure and motion help?
Conference paper under review
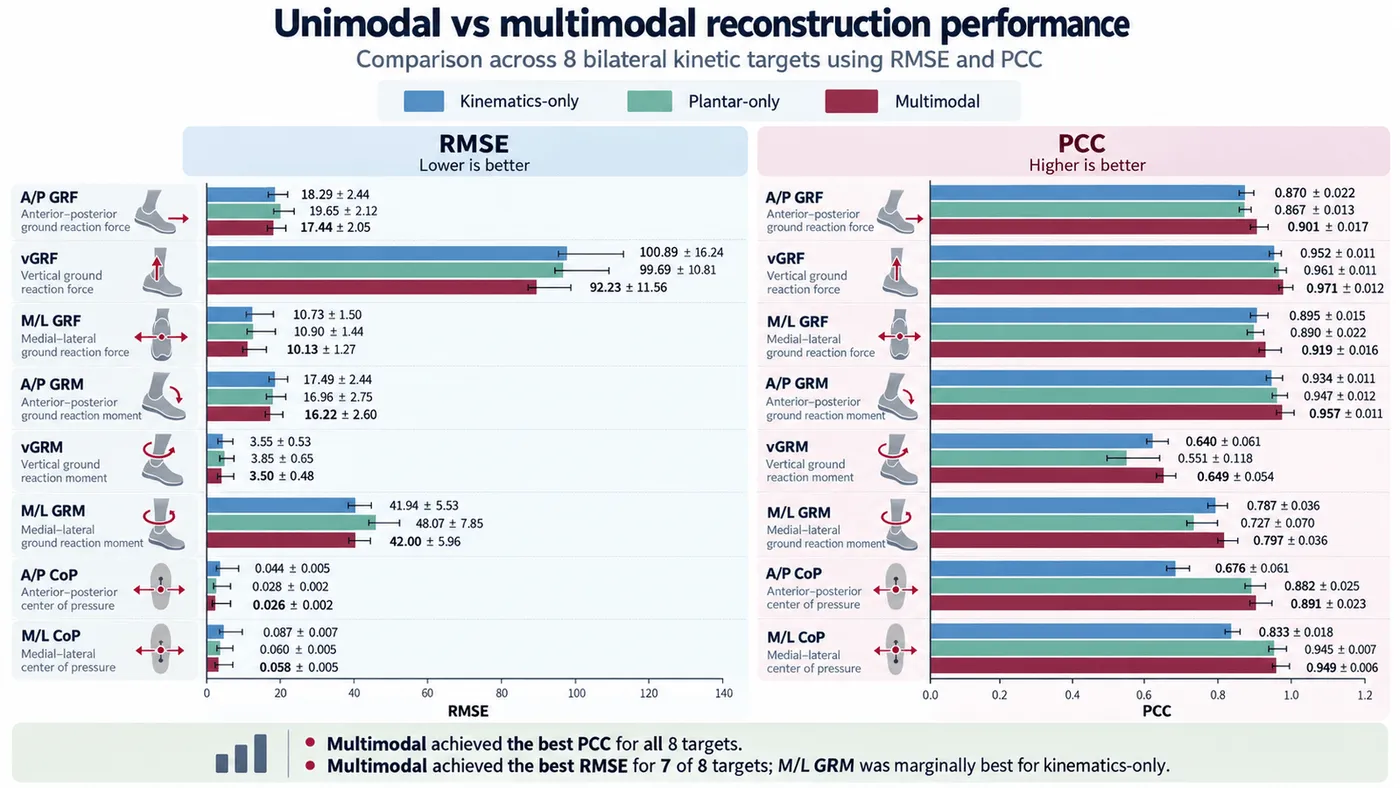
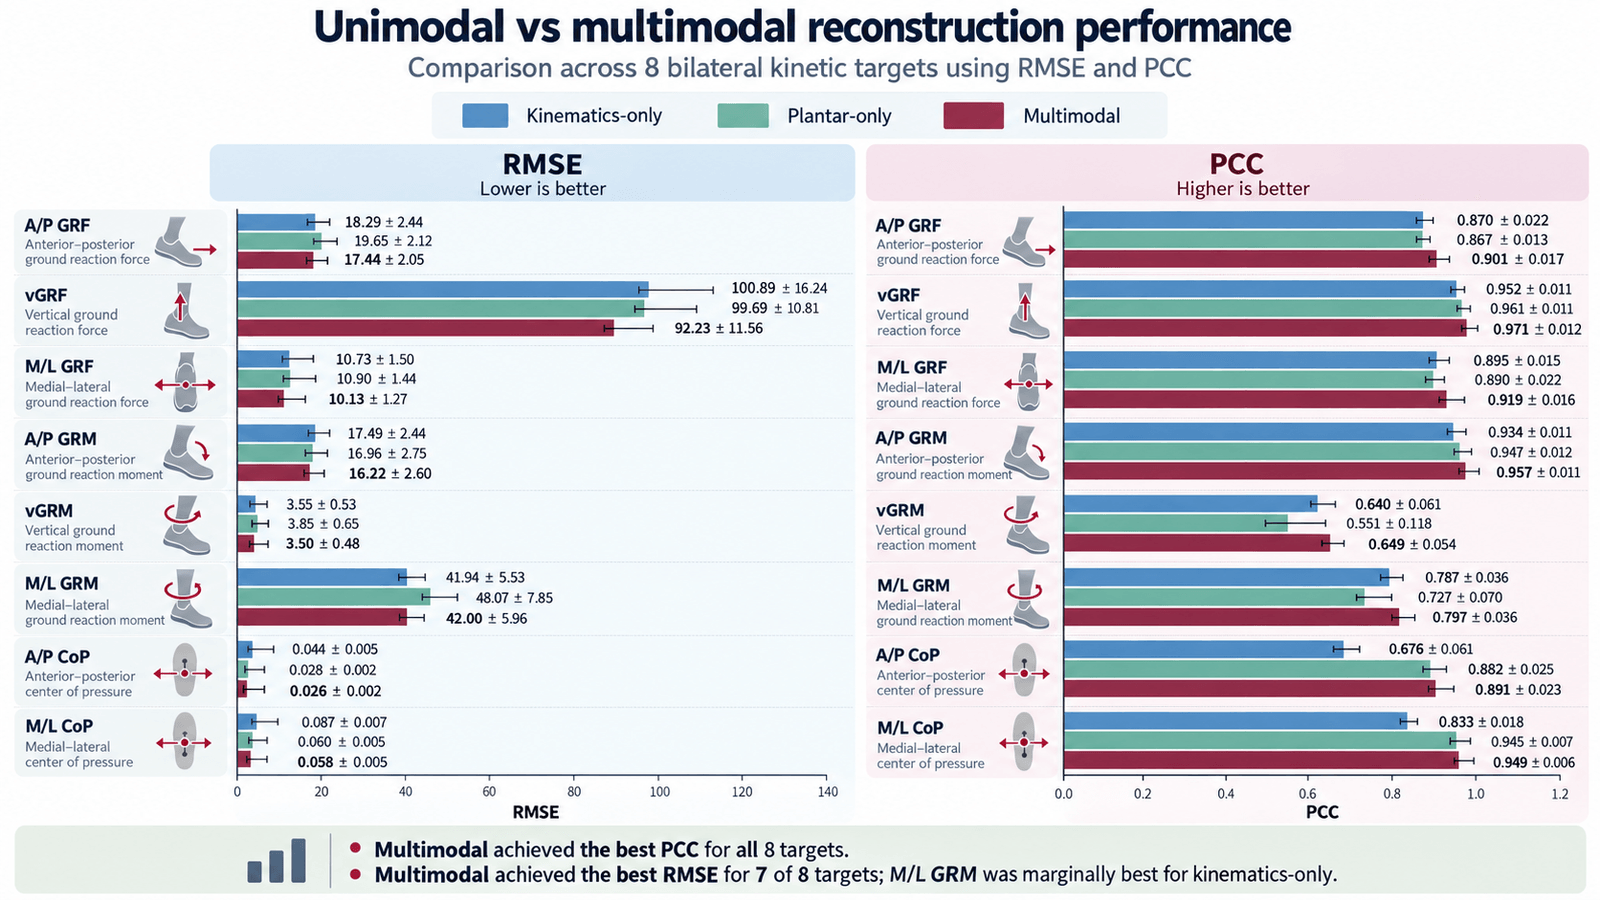
The first study of the funded phase compared kinematics-only, plantar-only and combined inputs with everything else fixed: the same presence-aware 1D U-Net, windows, outputs, training budget and held-out participants. The test set had 1,595 windows from nine participants.
Combined input gave the highest correlation and the lowest normalised error for every output type. Across all 16 outputs, normalised RMSE fell to 13.55% for walking and 13.00% for running, which is 7.1% and 2.6% lower than the better single modality. Plantar loading carried vertical force and centre of pressure, while kinematics carried several shear-force and moment components. The vertical moment remained the hardest output.
- Walking NRMSE with combined input (7.1% lower)
- 13.55%
- Running NRMSE with combined input (2.6% lower)
- 13.00%
- Vertical force correlation with combined input
- 0.971
KineNeXt++: reliability-aware fusion
In development · manuscript in preparation
KineNeXt++ gives kinematics and plantar loading separate temporal encoders and fuses them at several scales through a learned, presence-aware gate. The model can weigh each stream and keep working when one is missing. A nested decoder reconstructs all 16 bilateral outputs at once. For comparison, the pipeline also implements early fusion of the input channels and late averaging of single-modality predictions.
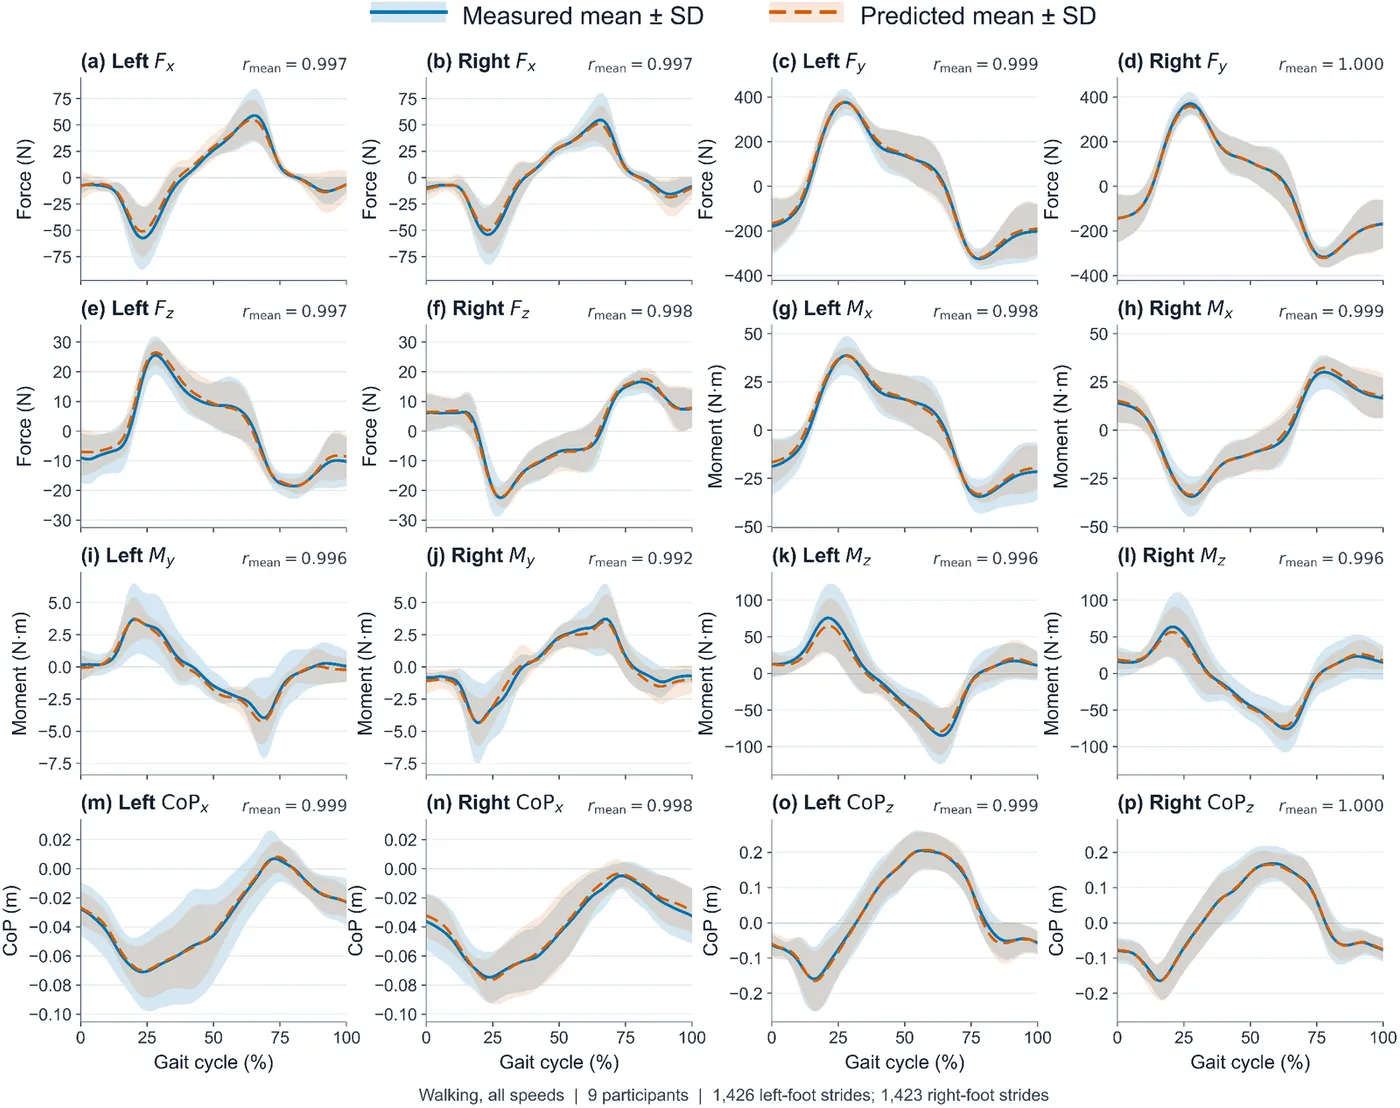
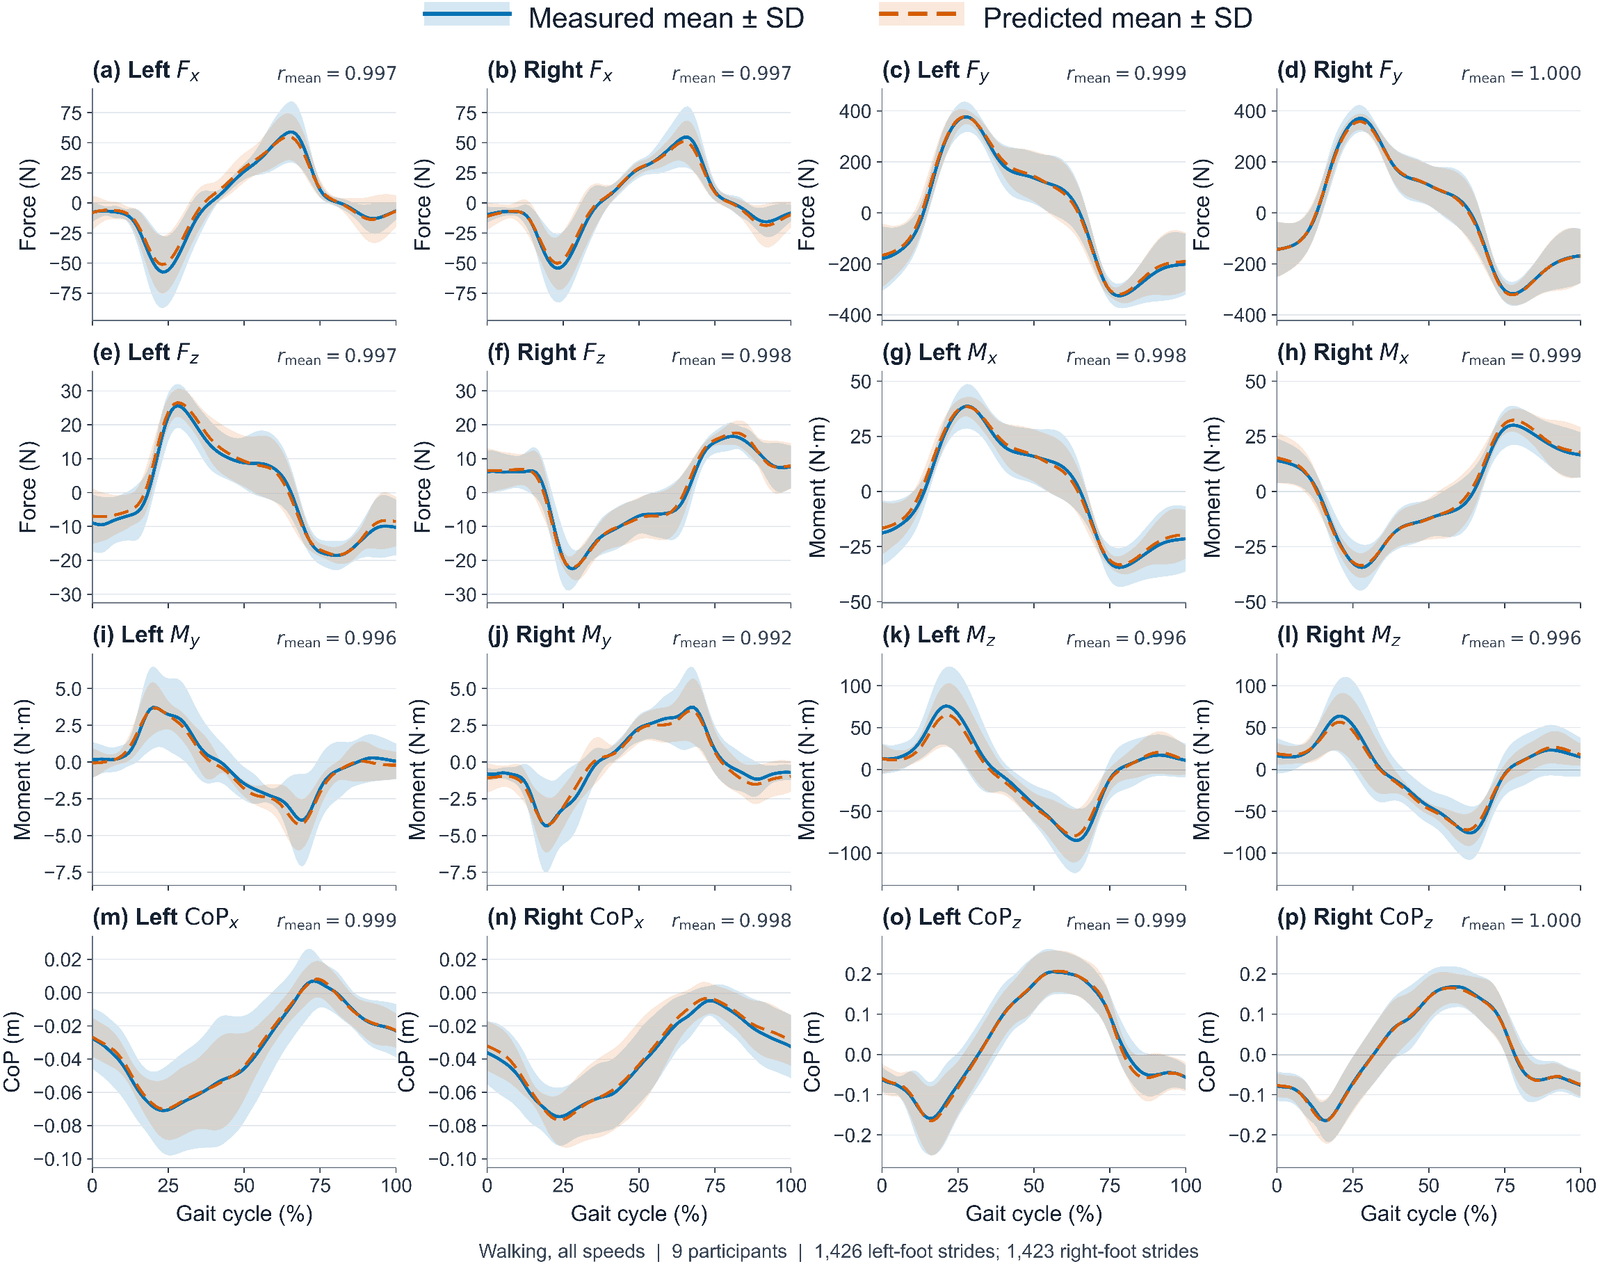
In internal experiments on the Twente data with participants held out, the fused model’s average walking gait cycles correlated with the measured averages at 0.992 to 1.000 for all 16 outputs. These correlations compare average curves rather than individual windows. Controlled comparisons against the U-Net baseline are under way.
Transferring to different insoles and sensors
Preliminary results · November 2026
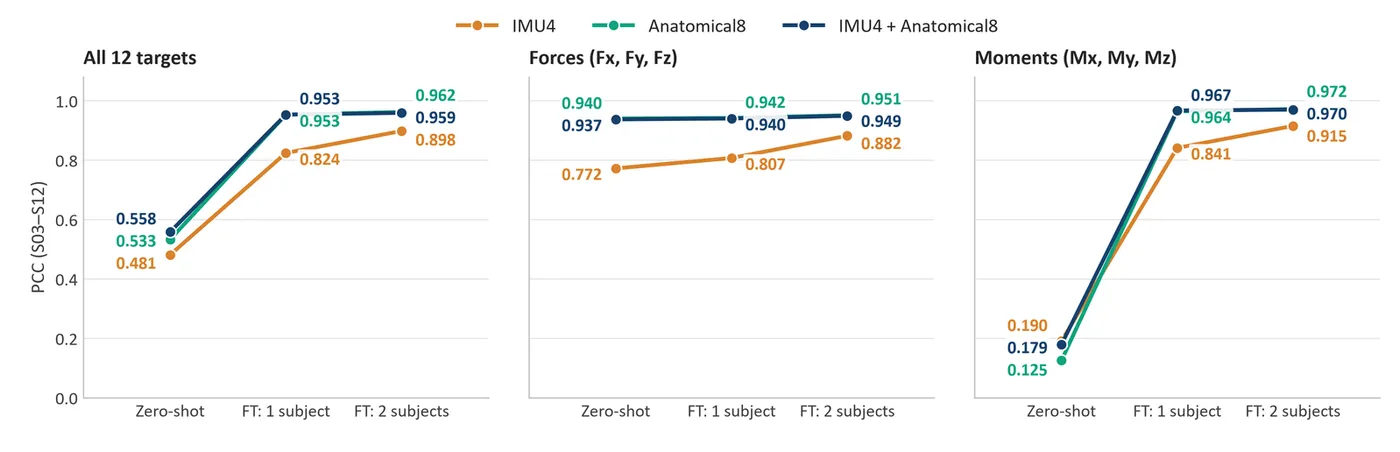
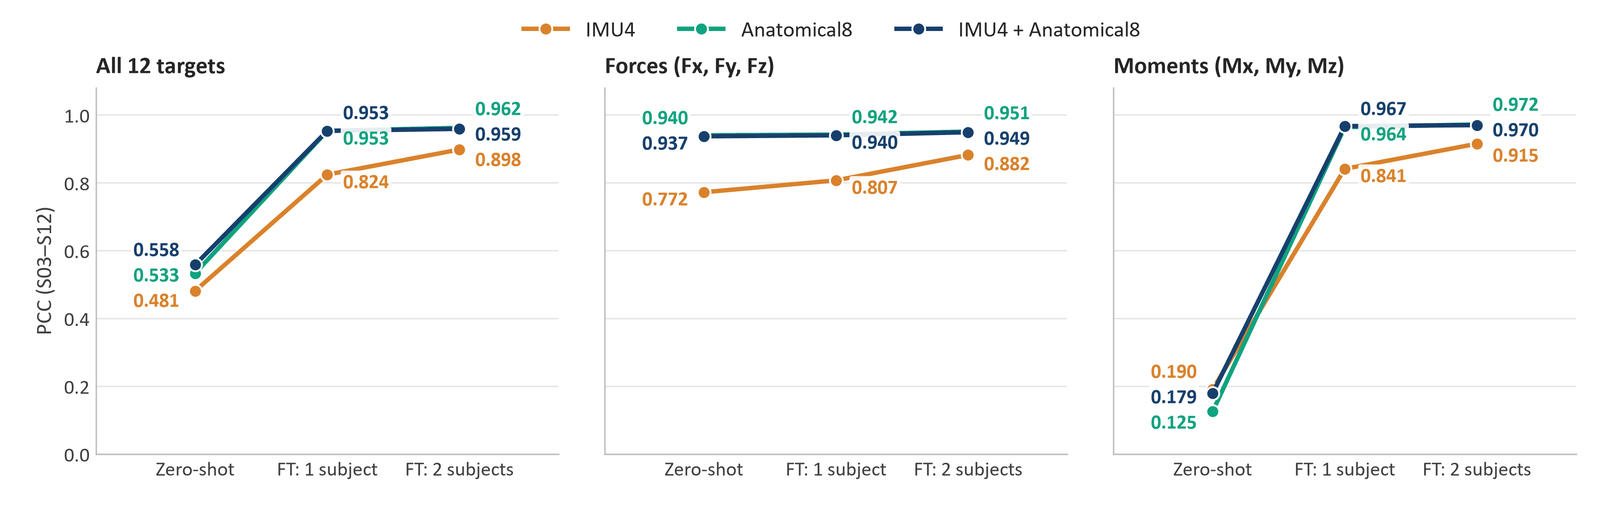
Comparing datasets recorded with different equipment needs a shared input. The project defined two portable inputs. IMU4 is six ankle angles estimated from one foot IMU and one shank IMU per leg. Anatomical8 is eight regional pressures per foot that map both the 16-cell Moticon and the 99-cell Pedar insoles onto the same anatomical regions.
Models trained on Twente were tested on ten held-out Lee and Lee participants. Forces transferred without retraining when regional pressures were included, with a correlation of 0.940 for Anatomical8. Moments did not transfer, staying below 0.2, because the two datasets define moments about different origins. Fine-tuning on one or two participants from the new dataset recovered most of the gap: correlation across all 12 compared outputs rose to 0.953–0.962 with regional pressure input and to 0.898 with IMU4 alone. Adapting only the output layers came within 0.011 of fine-tuning the whole model.
- Force correlation without retraining (Anatomical8)
- 0.940
- Correlation after fine-tuning on two participants
- 0.962
Smart-insole hardware and sensor development
In progress · 2026
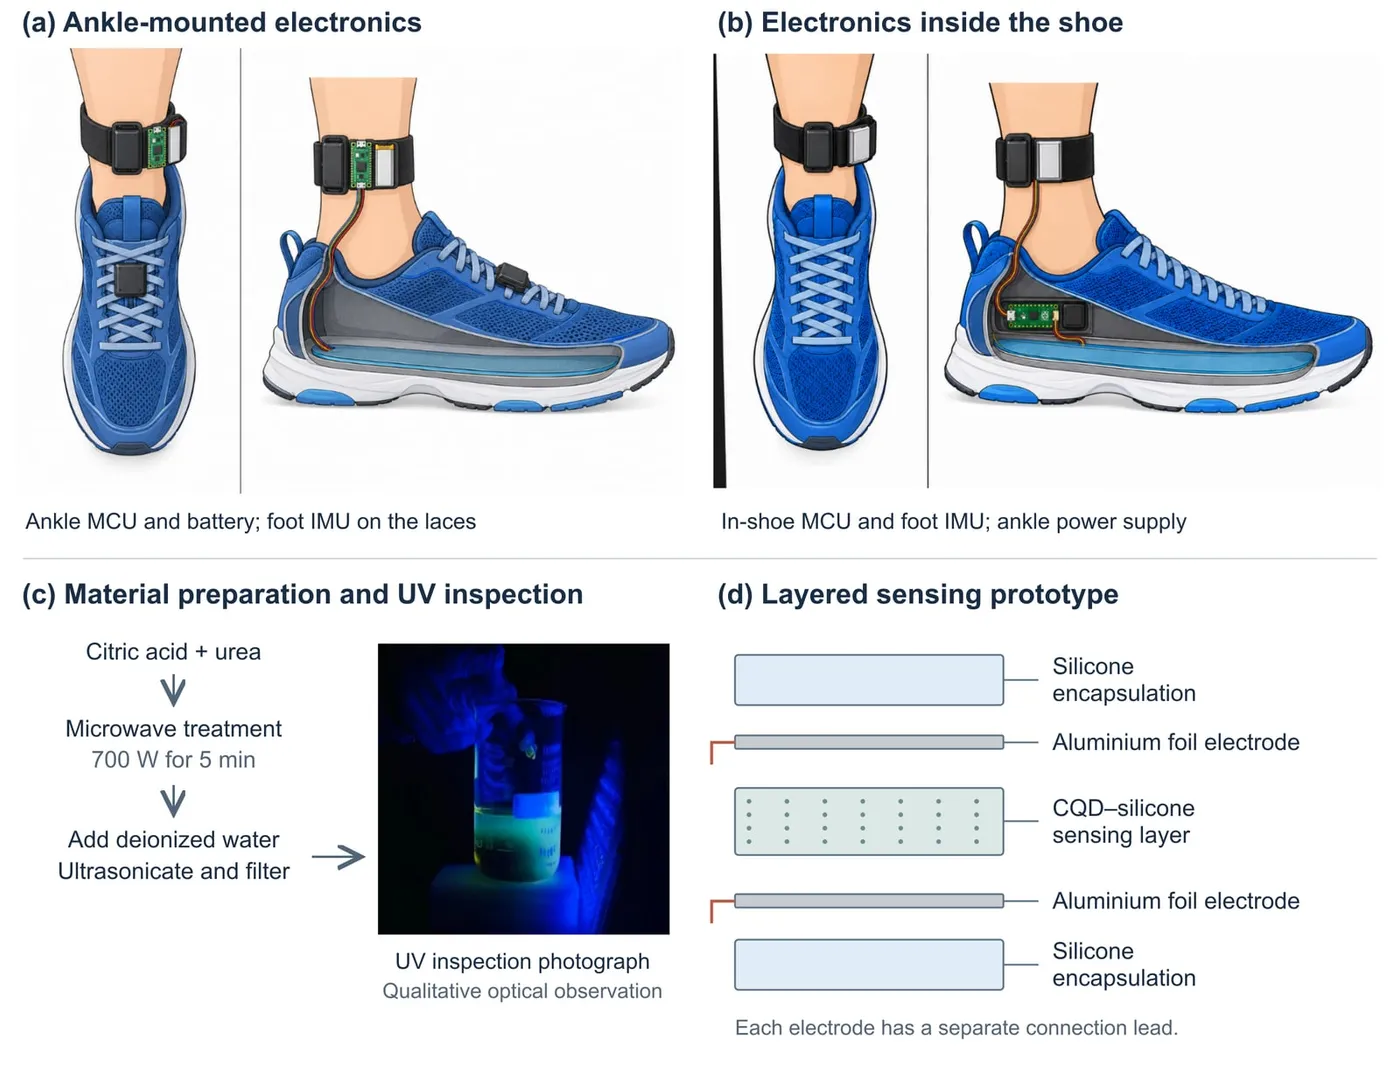
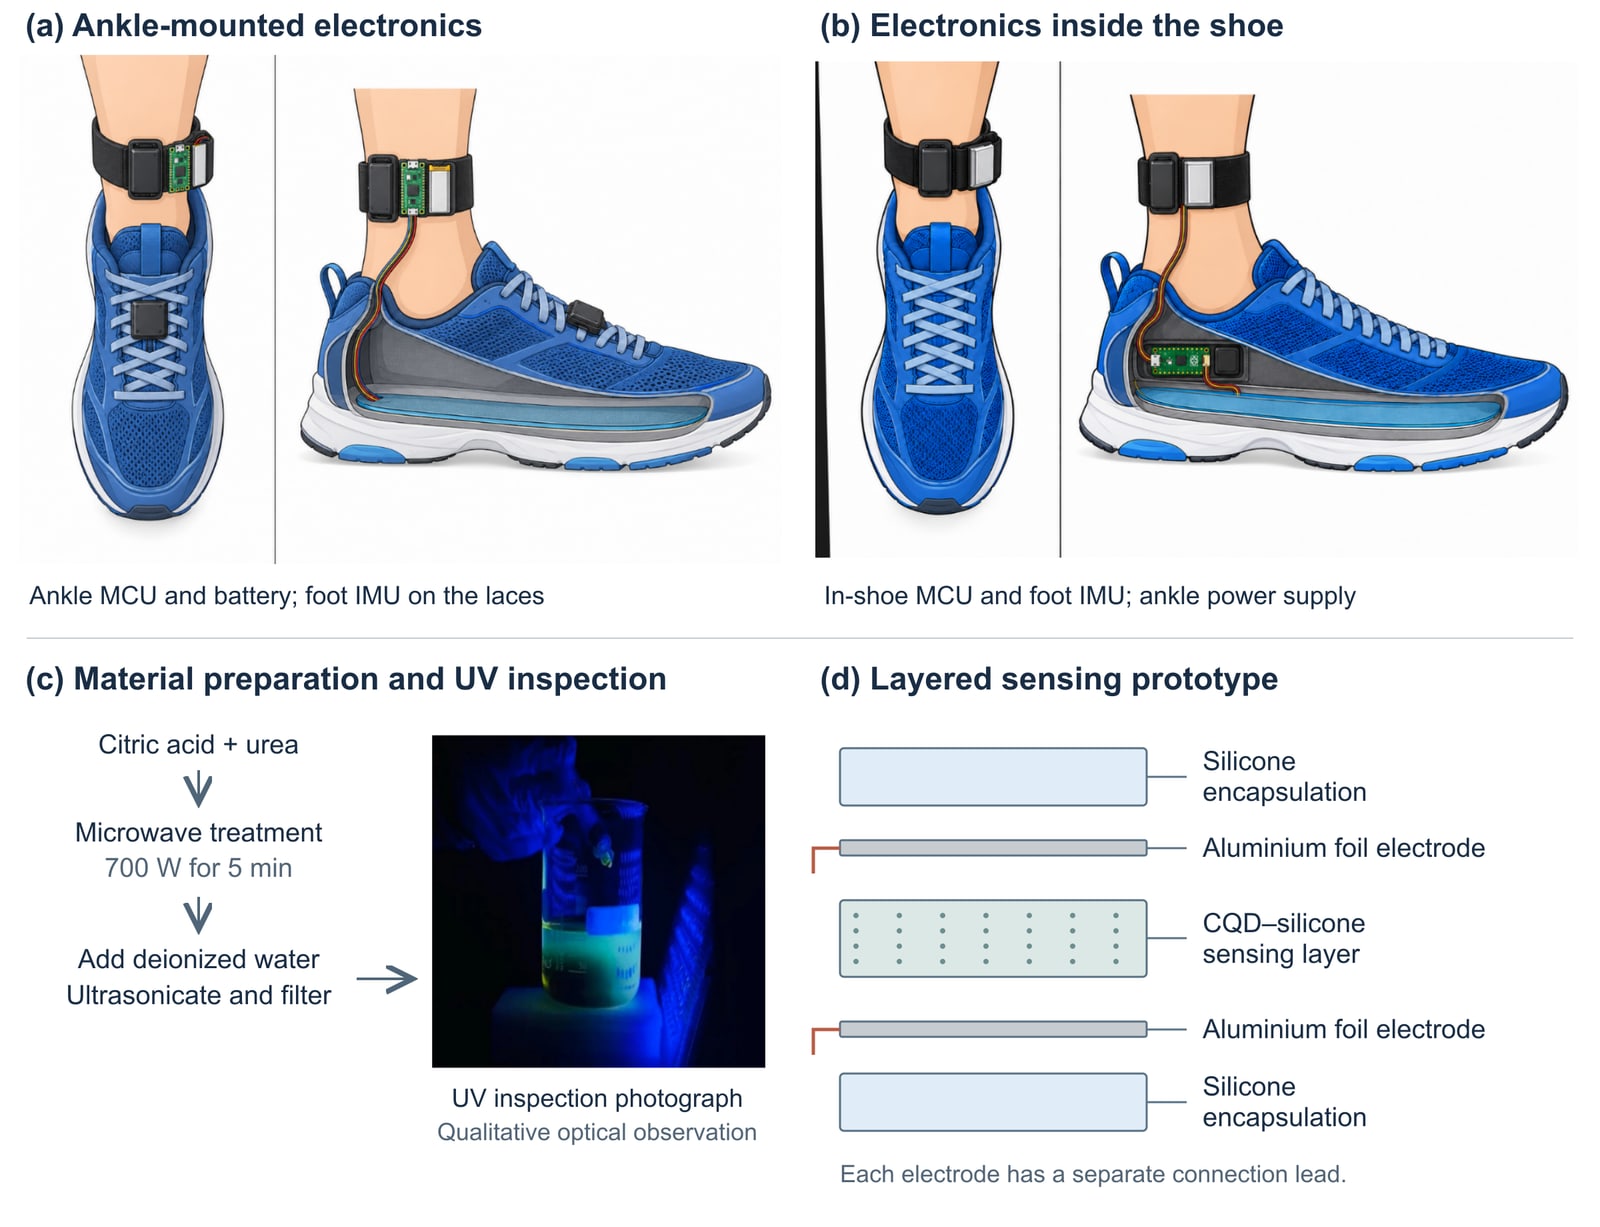
The wearable concept combines resistive plantar sensing with two IMUs per leg, one above the ankle and one on the foot. In the first design, an ankle strap carries the microcontroller and its battery, and the foot IMU sits on the laces. In the second, the microcontroller and foot IMU sit inside the shoe near the side wall. That shortens the sensor wiring while keeping an ankle-mounted power supply and shank IMU. Both designs wire the plantar sensor to the microcontroller. The insole’s channel count and placement will follow the earlier sensor-layout analysis.
With the Qatar University Center for Advanced Materials, the team prepared carbon quantum dots (CQDs) from citric acid and urea by microwave heating and built a layered sensor. It has a silicone base, a lower aluminium-foil electrode, a CQD–silicone sensing layer, a perforated upper foil electrode and a silicone cover. Multimeter checks showed a small change in resistance under load, together with drift over time. Sensitivity, pressure range and repeatability have not yet been quantified.
Next, moulded fabrication will standardise layer thickness and electrode overlap. Controlled loading and unloading will then measure response, hysteresis, recovery, drift and repeated-cycle stability. A measurement circuit and calibration are needed before the microcontroller can read the sensor. The planned electronics include wired and wireless WitMotion IMUs and Raspberry Pi Pico 2 W boards.
Application and system integration
Requirements defined · implementation next
A mobile, web or desktop application will connect device configuration, synchronised recording, storage, reconstruction and waveform display. It will keep timestamps, sensor and foot identifiers, calibration information and data-quality flags. Recorded streams must follow the selected model’s channel definitions and preprocessing, including the portable IMU4 and Anatomical8 inputs.
The first milestone is an offline or simulated-data demonstrator, followed by connection to the pressure and IMU hardware after bench verification. Integration tests will check synchronisation, missing-input handling, recording integrity and recovery from interrupted transmission. They will also time each step from window buffering and preprocessing through data transfer, inference and display.
Research stages and outputs
Foot motion as a predictor of forces and moments
Used an attention-guided MultiResUNet to estimate three forces and three moments from trajectories of five shoe-mounted markers. Two public gait datasets provided laboratory reference measurements for walking and running.
Reconstructing 3D kinetics from smart-insole loading
Ke2KeNet reconstructed forces, moments, and centre of pressure using 16 vertical-loading channels per insole. The study used instrumented-treadmill references and held out participants during evaluation. This work established the pressure-only baseline before the collaborative grant began.
Combining plantar loading with inertial motion
The funded phase harmonised two public gait datasets, then compared loading-only, motion-only and fused inputs using a common 1D U-Net and held-out participants. Fusion lowered normalised error by 7.1% for walking and 2.6% for running. Current work develops reliability-aware fusion (KineNeXt++) and tests transfer to different insoles and sensors through compact portable inputs. The target is eight outputs per foot.
My contribution
I contributed to the motion-based study and led the preprocessing, model development, evaluation, and writing for the insole study. In the current project I develop synchronisation and sensor-fusion methods and evaluate how estimates transfer across participants, datasets, and sensor configurations.
Scope and validation
The published studies and current benchmarks use existing gait recordings. The project has also begun bench development of the sensing element. New synchronised treadmill recordings and validation of the integrated prototype are planned.
Next steps
Controlled comparisons will test KineNeXt++ and a transformer-based variant, KineFusionFormer, against the U-Net baseline, including how well each copes when sensor streams or channels drop out. On the hardware side, calibrated pressure sensing and readout electronics come next, followed by the application demonstrator. After the required ethics approvals, the integrated system will be validated against an instrumented treadmill in at least 30 healthy adults with Aspetar.
Publications
- Robust and novel attention guided MultiResUnet model for 3D ground reaction force and moment prediction from foot kinematicsNeural Computing and Applications · 2024 (online 2023)
- 3D Foot Kinetics Estimation From Distributed VGRF From Smart Insoles via 1D Domain TransformationIEEE Journal of Biomedical and Health Informatics · 2026 (online 2025)
Code
- Unimodal-3D-Kinetics-Estimation-from-Insole-or-IMUResearch software and repository details