Wearable biomechanics · 2020–2024
Smart insoles for diabetic-foot monitoring
Building insoles that measure plantar pressure and temperature with three sensing technologies: electronic sensors, fibre Bragg gratings, and laser-induced graphene.
BSc senior design project and QNRF UREP, continued under QNRF NPRP12S-0227-190164 with Universiti Kebangsaan Malaysia · three Q1 journal papers
Approach
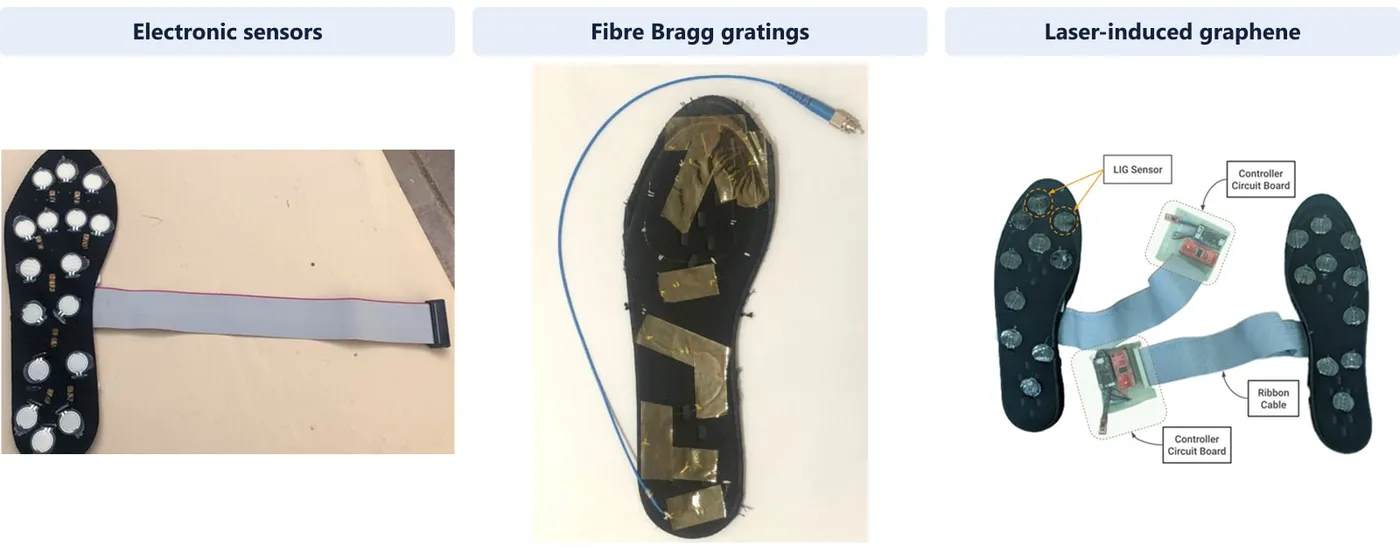
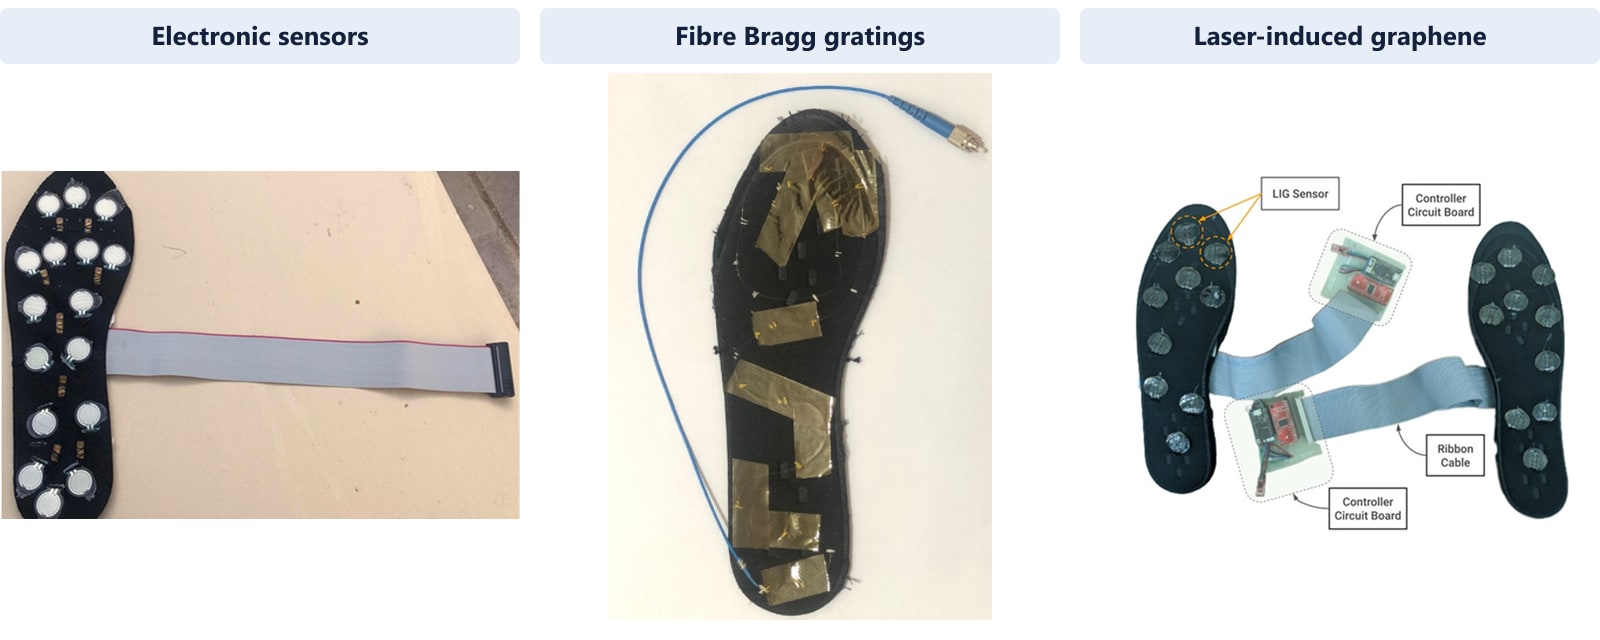
Diabetic foot ulcers often follow nerve damage that stops people noticing injury. Two early warning signs are abnormal plantar pressure and a temperature difference between the two feet, and both can be watched at home if an insole measures them continuously. Commercial systems that record pressure and temperature together are scarce and expensive. The project built three insoles for this purpose, each with a different sensing technology: off-the-shelf electronic sensors, fibre Bragg gratings on an optical fibre, and laser-induced graphene. The sections below start with the senior design project the work grew from, describe each insole in order of publication, and then compare the three.
- Sense plantar pressure and temperature
- Acquire and transmit in real time
- Map both feet and compare
Origin: BSc senior design project
BSc Electrical Engineering · Qatar University · 2020
The project began as my BSc senior design project in Electrical Engineering at Qatar University, “Design and Implementation of a Novel Real-time Wearable System for Early Detection of Diabetic Foot Ulcer”, supervised by Dr Muhammad E. H. Chowdhury. The aim was an insole that people with diabetes could wear at home to record plantar pressure and temperature continuously and flag early signs of ulceration.
The work continued through the QNRF Undergraduate Research Experience Program (UREP23-031-2-014, January–May 2020), which supported development of the electronic and photonic insole prototypes.
The prototypes matured into three Q1 journal papers, supported by QNRF NPRP12S-0227-190164 together with grants from Universiti Kebangsaan Malaysia. The electronic and fibre-optic insole papers are direct outcomes of the senior design project.
- Q1 journal papers
- 3
- Papers from the senior design project
- 2
Electronic insole with off-the-shelf sensors
Published · Sensors, 2022
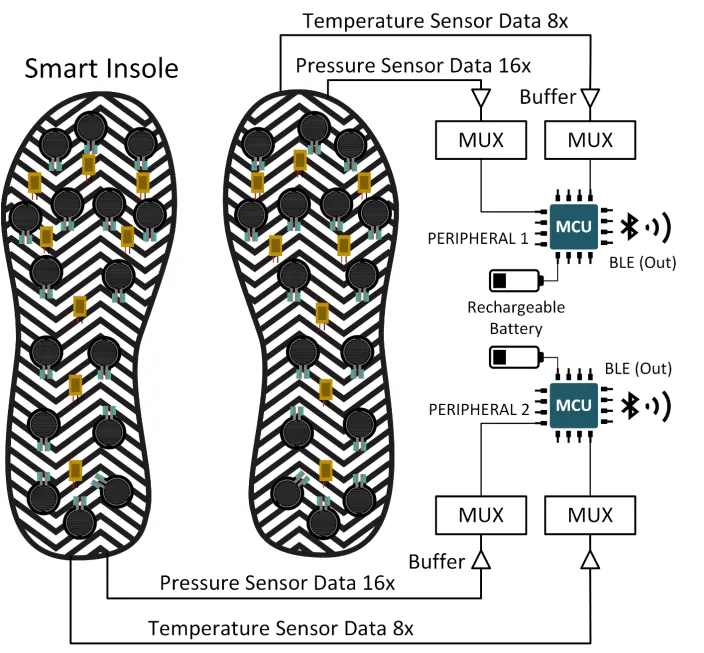
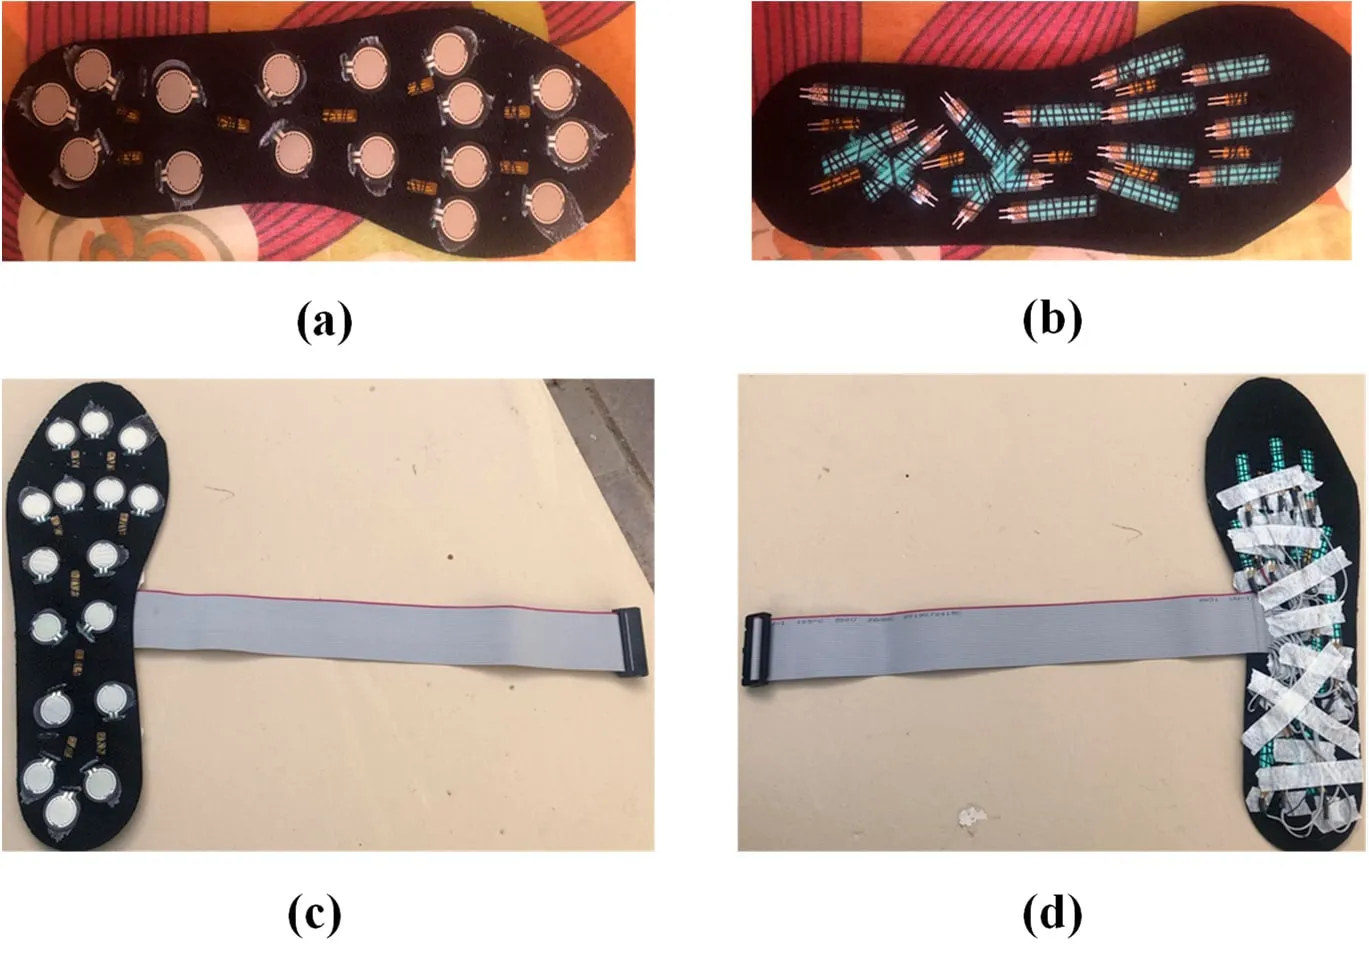
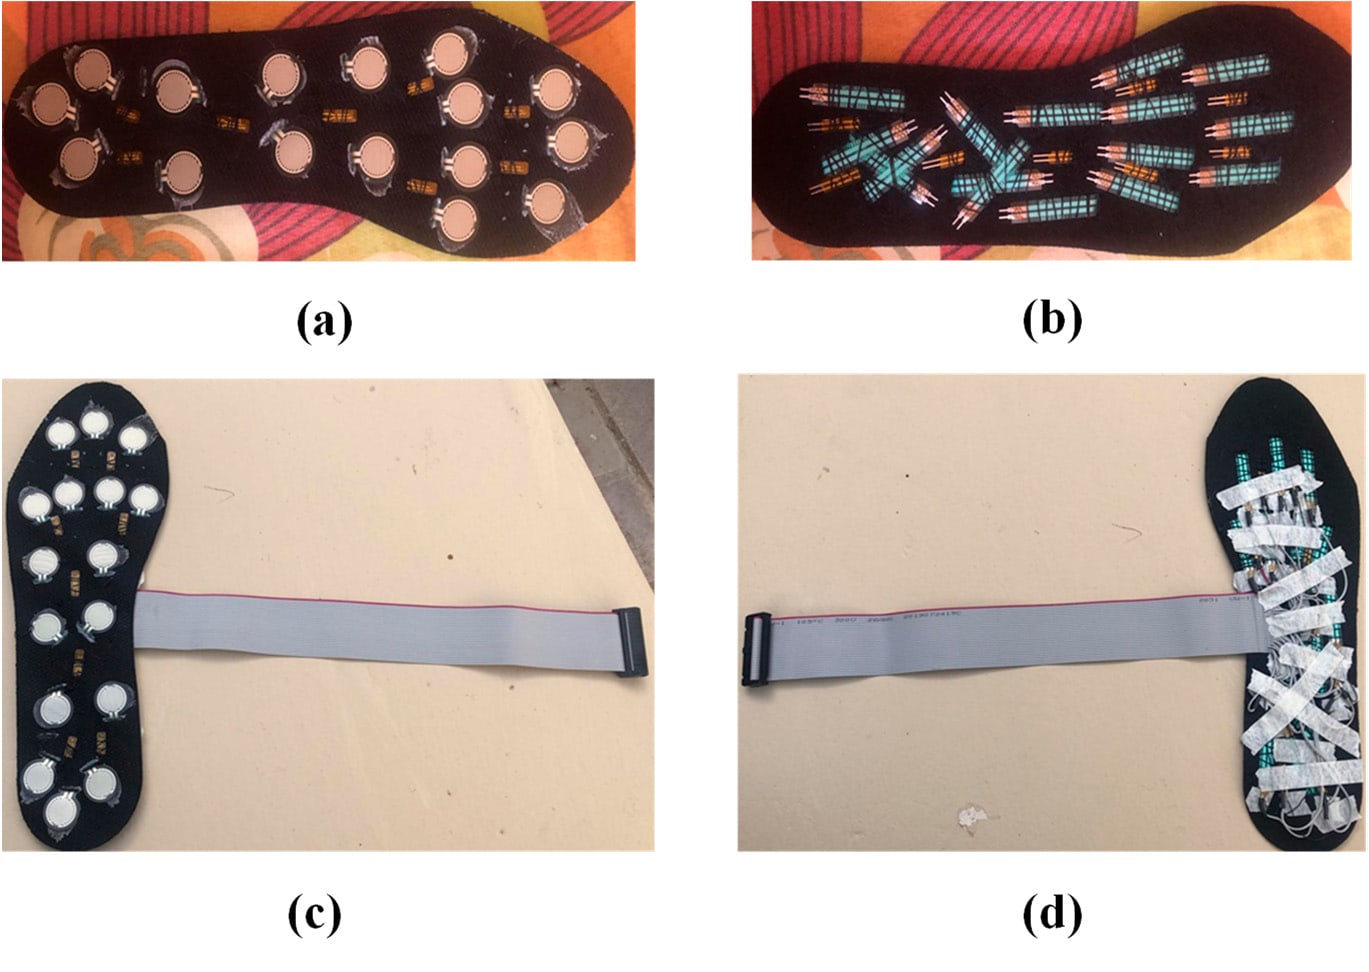
The first prototype used inexpensive, off-the-shelf parts. After characterising three candidate pressure sensors (force-sensitive resistors, piezoelectric discs and a Velostat sheet), the design placed 16 force-sensitive resistors and eight thermistors on each insole. Multiplexers feed the readings to a microcontroller on each foot, and a low-power Bluetooth link sends them to a central device for storage and display.
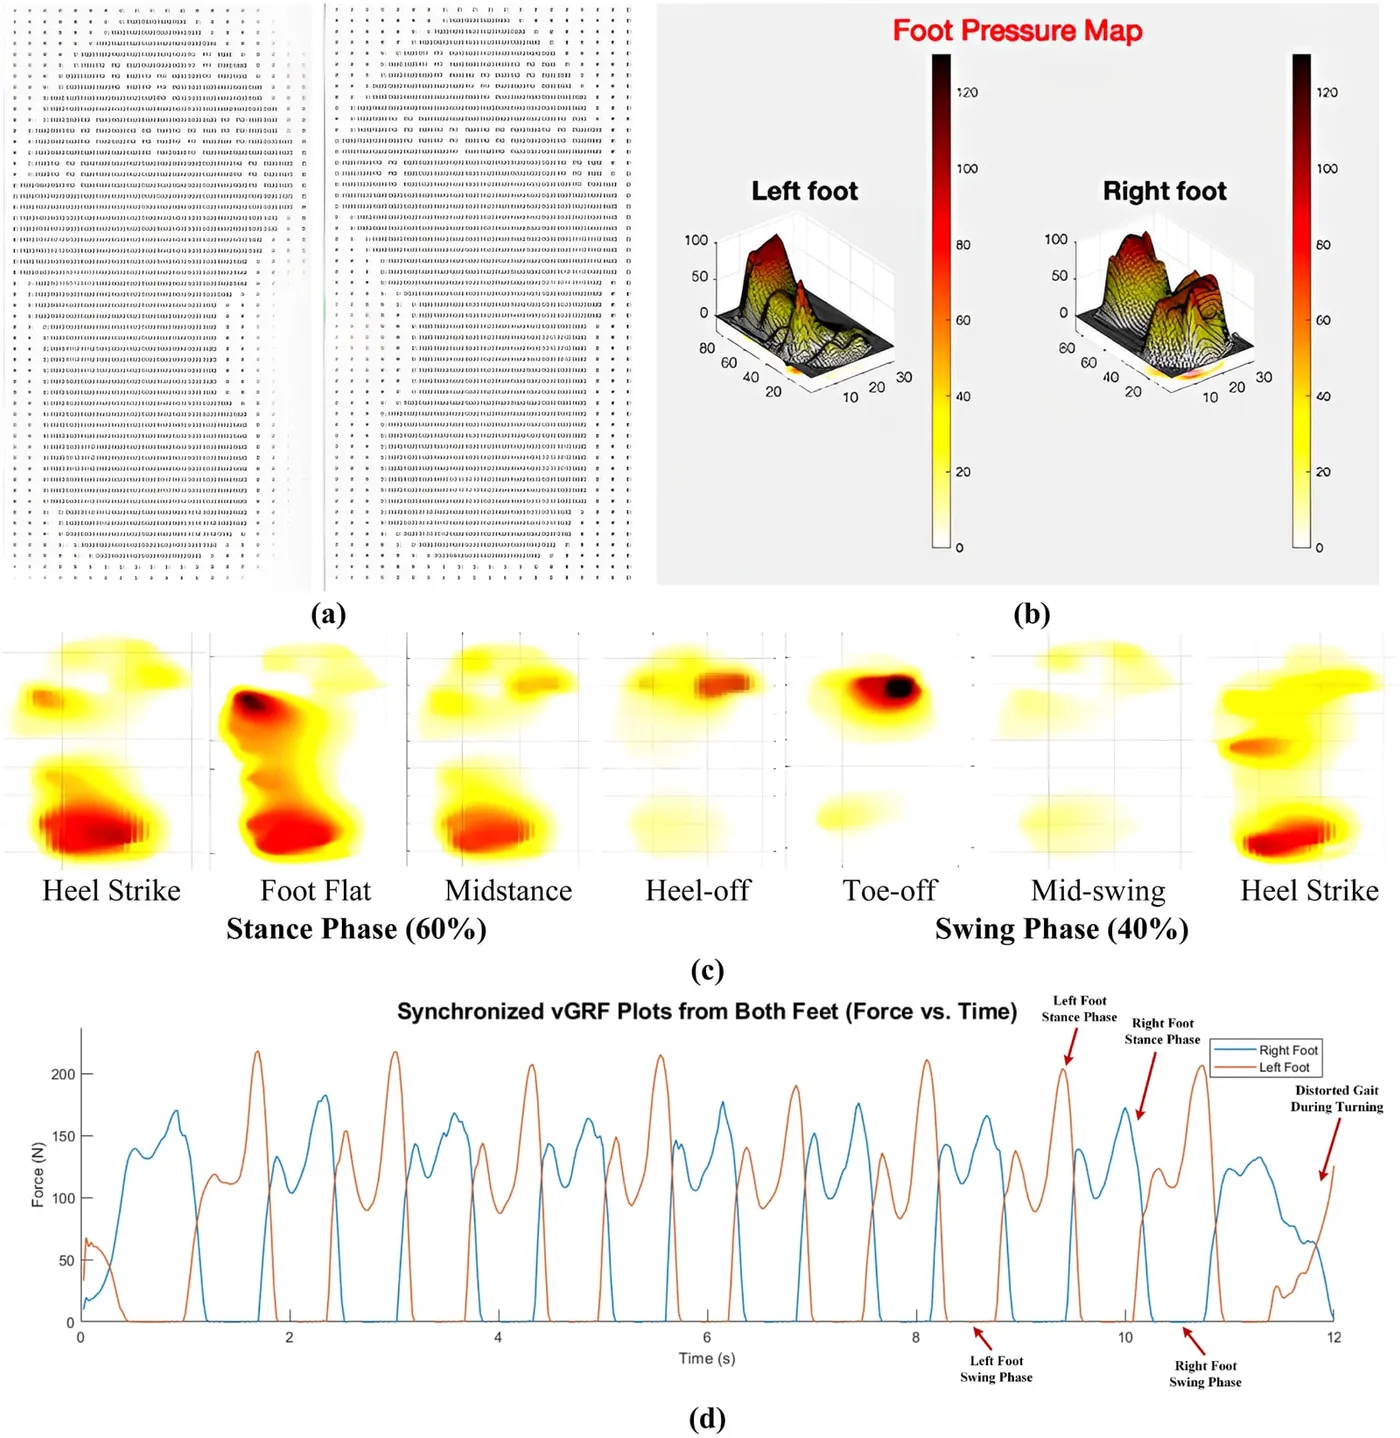
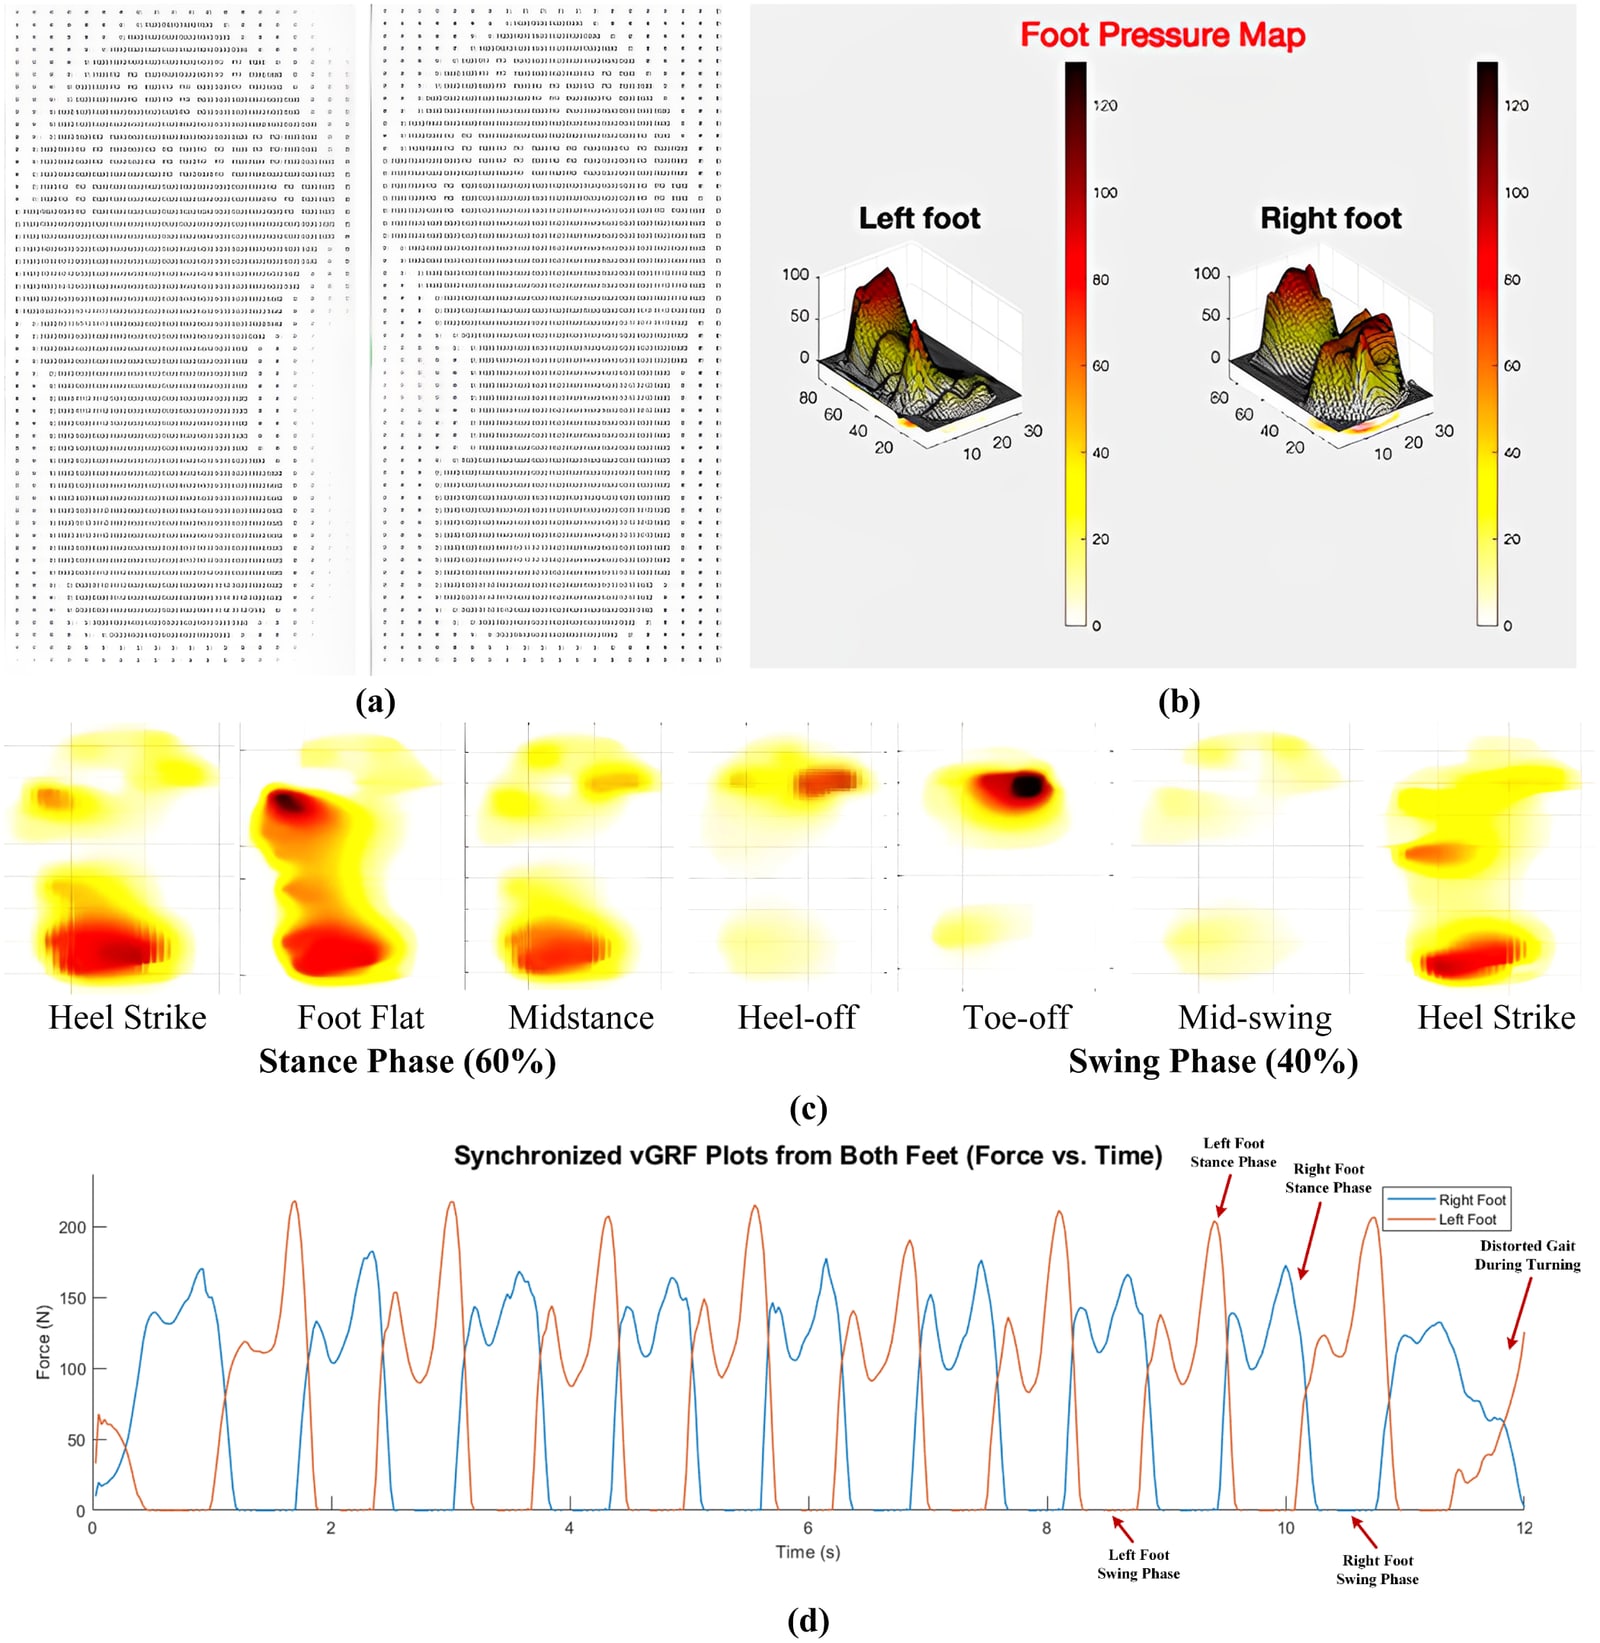
The insole produced real-time plantar pressure and temperature maps and gait-cycle plots. The components cost about US$170, compared with more than US$20,000 for commercial plantar-pressure systems. The paper sets out the sensors, characterisation circuits and design considerations so that the build can be reproduced.
My role, as second author: I integrated the sensors into the insole and contributed to the methodology, data acquisition, experiments, analysis and manuscript review.
- Pressure and temperature sensors per insole
- 16 + 8
- Estimated cost, against > US$20,000 commercially
- ≈ US$170
Fibre Bragg grating insole for pressure and temperature together
Published · Sensors and Actuators A: Physical, 2023
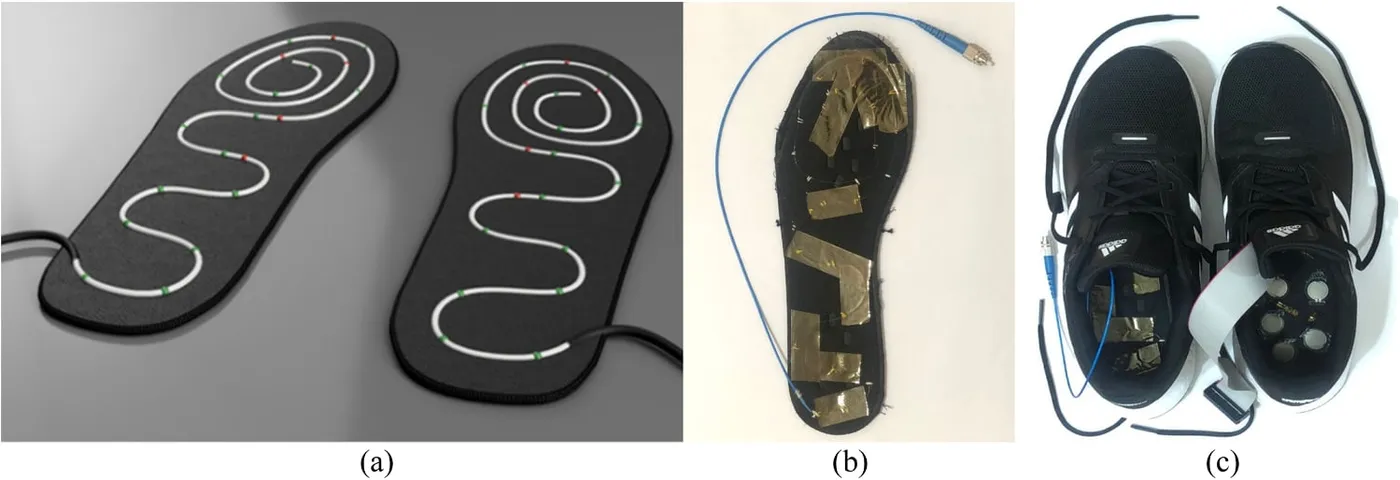
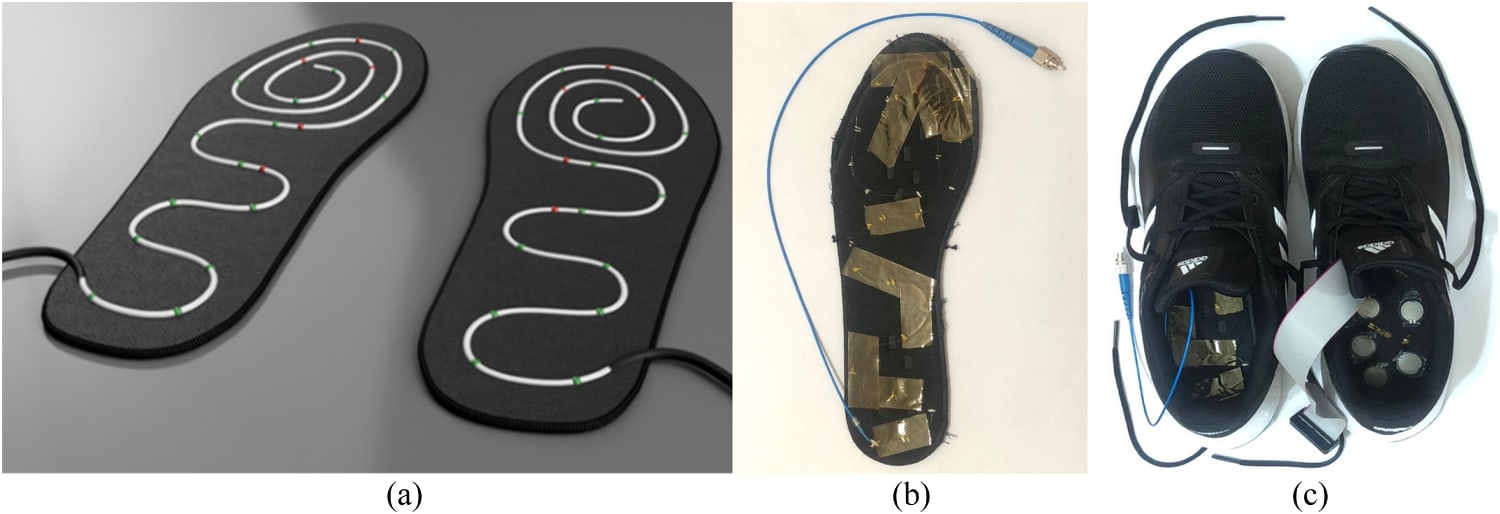
The second prototype replaced the electronic sensors with fibre Bragg gratings: reflectors written into a single optical fibre whose reflected wavelength shifts with strain and temperature. One spiral fibre routed through the insole carries both pressure and temperature sensing points, read by an optical interrogator. The gratings were characterised against applied force and reference temperature sensors, and the fitted responses were close to linear.
Tested during standing and walking, the insole measured plantar pressure and temperature at the same time with reasonable precision. It displayed pressure maps, temperature maps and gait-cycle plots in real time. The study compared it with the electronic insole and with a commercial F-Scan system, which has 960 sensing cells per insole. The fibre-optic insole used far fewer sensors, is electronically safer, and cost more than eight times less to develop than the commercial system.
My role, as first author: I led system development and experimental evaluation, including data acquisition and analysis, validation against the electronic and commercial systems, and manuscript preparation.
- Lower development cost than the commercial system
- > 8×
- Pressure and temperature on one optical fibre
- 2 in 1
Laser-induced graphene for plantar temperature mapping
Published · IEEE Sensors Journal, 2024
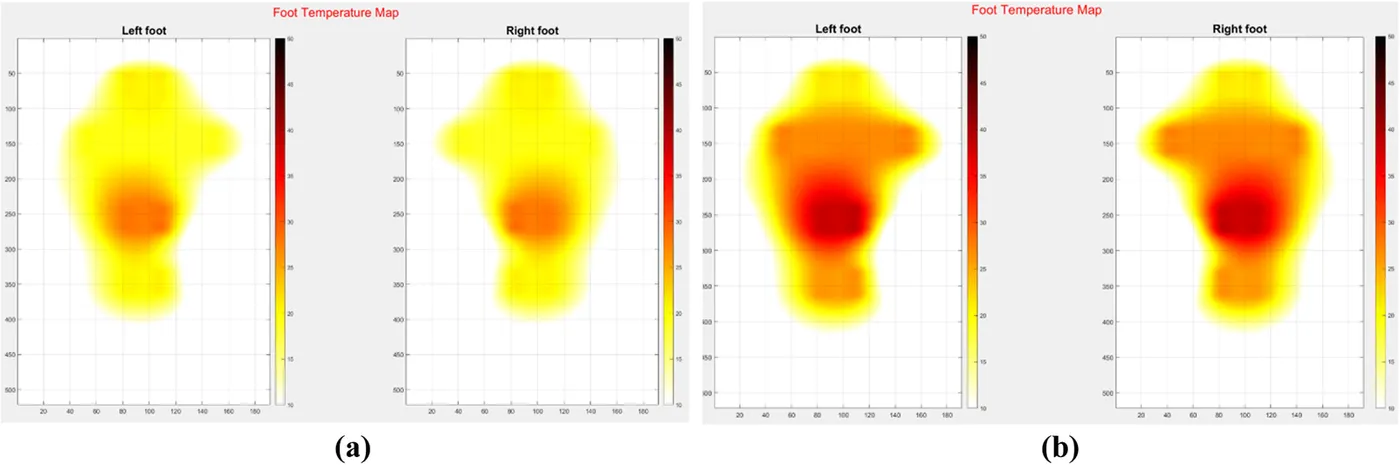
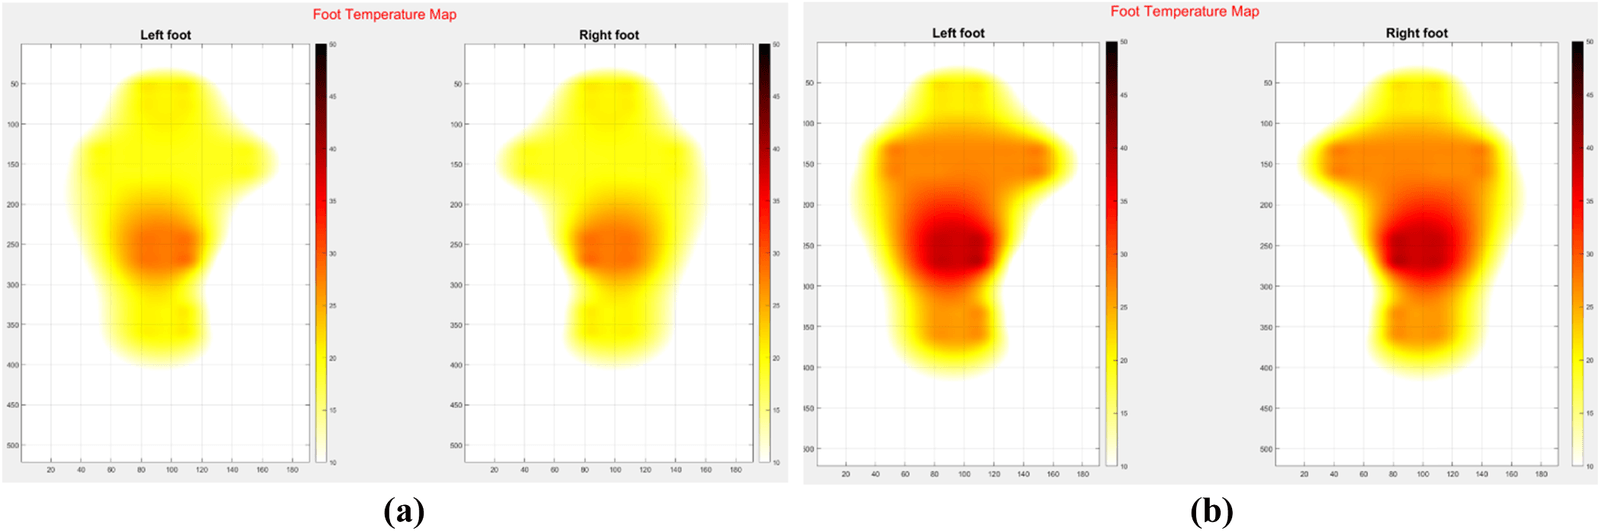
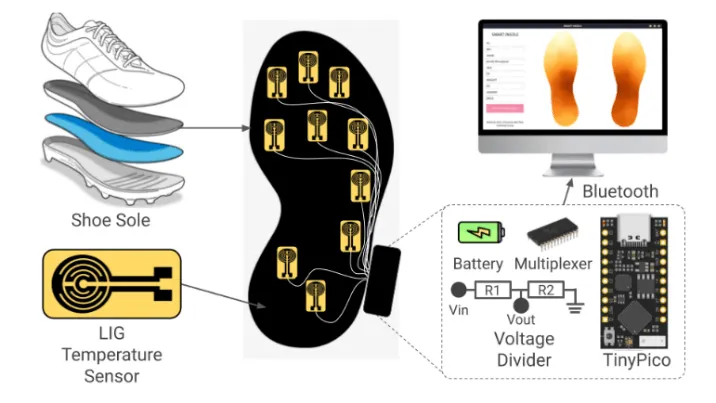
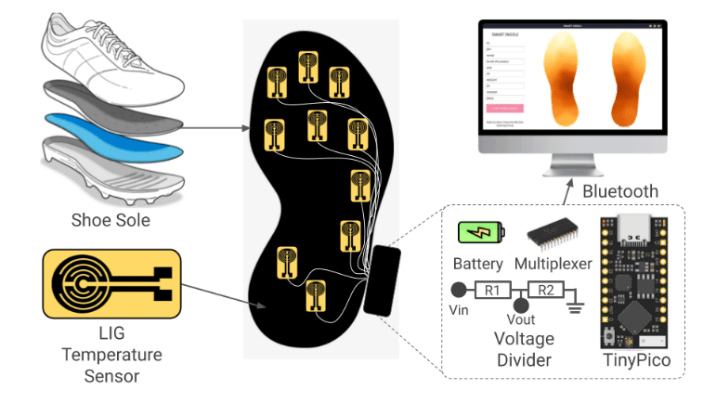
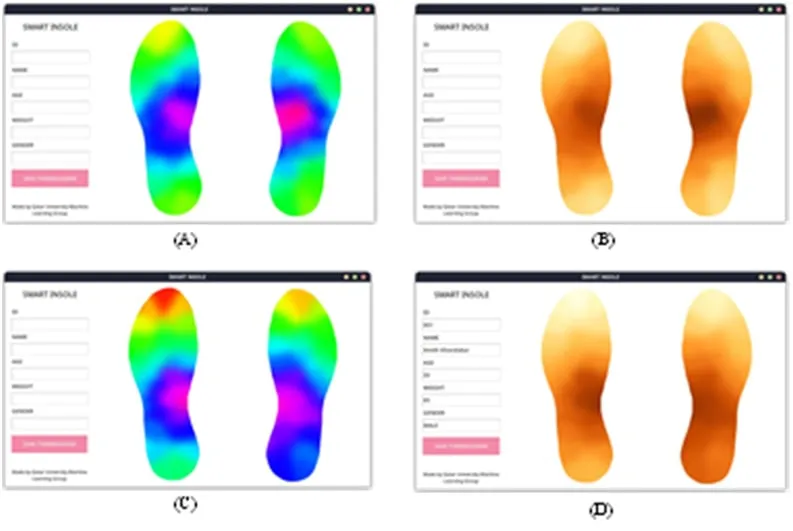
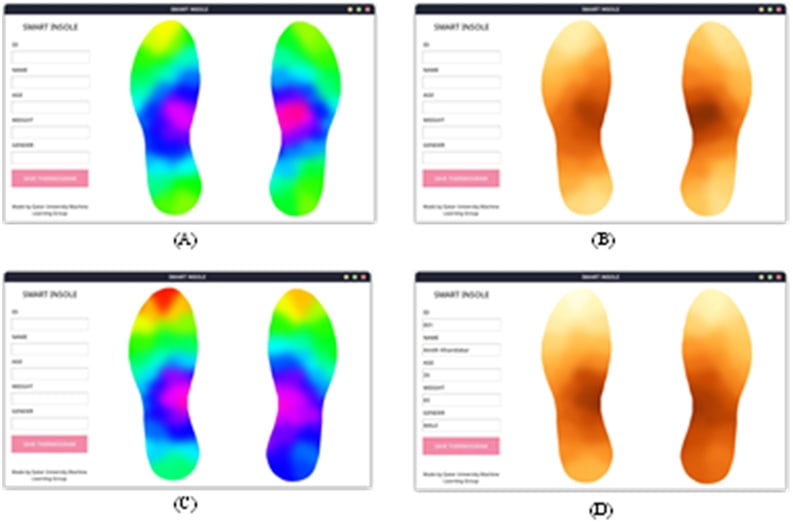
The third study made the temperature sensors from laser-induced graphene. A 30 W CO₂ laser scribes the sensor pattern into a polyimide (Kapton) sheet and converts it into porous graphene, confirmed by Raman spectroscopy, and copper electroplating adds the contacts. Ten sensors per insole, 20 in total, connect through a 16-channel multiplexer to a TinyPico microcontroller, which sends readings over Bluetooth to an application that draws plantar temperature maps.
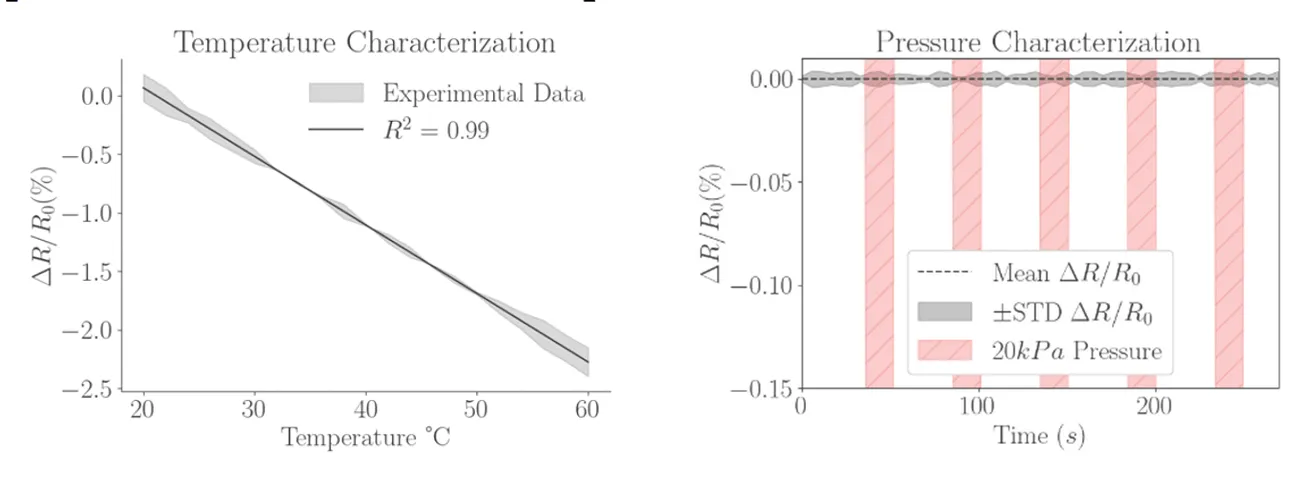
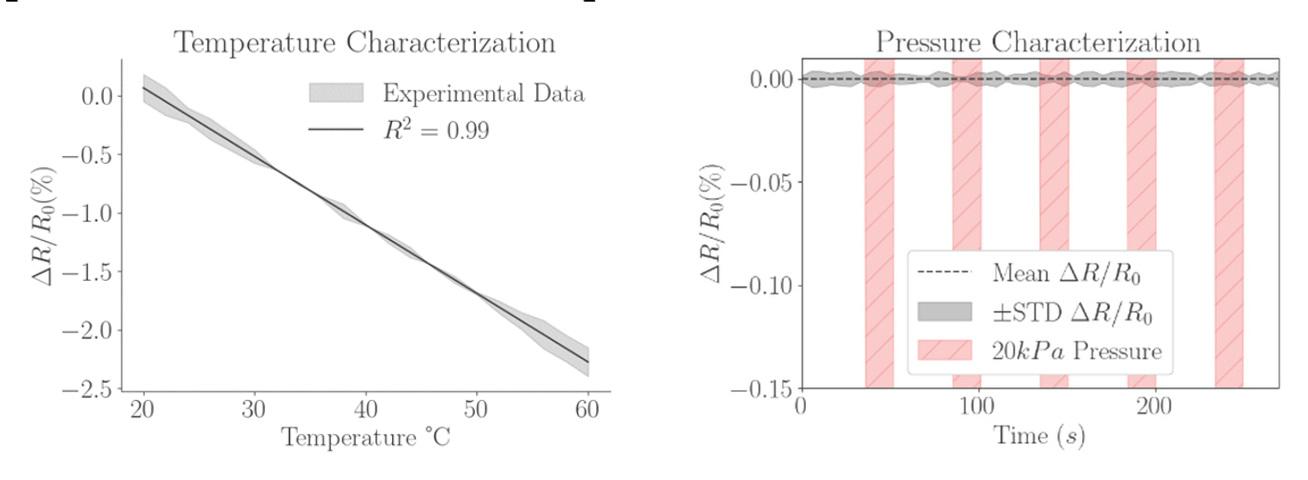
Every sensor was calibrated at 20 and 60 °C. Resistance fell linearly with temperature across that range, with a temperature coefficient of −0.0575% per °C (R² = 0.99) and a precision of about 0.1 °C. The response to 20 kPa of pressure and to bending and stretching was negligible, and a change in humidity from 30% to 80% would add at most ±0.8 °C of error. Maps recorded from two healthy volunteers showed the symmetric butterfly pattern expected in healthy feet.
The authors report this as the first insole to use laser-induced graphene for plantar temperature maps. Some wire connections failed under the stress of running, and long-term stability is being tested through daily wear.
My role: I contributed to the experimental and technical assessment of the system, interpretation of the findings and manuscript review.
- Linear temperature response (R² = 0.99)
- −0.0575%/°C
- Temperature measurement precision
- ≈ 0.1 °C
- Graphene sensors across both insoles
- 20
Comparing the three sensing approaches
Summary across the three papers
Each insole traded cost, sensor count, precision and robustness differently. The electronic design was the cheapest and easiest to build. The fibre-optic design measured both quantities on a single, electrically safe fibre. The graphene design gave the thinnest and most precise temperature sensing. All three have far fewer sensing points than a commercial pressure insole.
| Electronic sensors (2022) | Fibre Bragg gratings (2023) | Laser-induced graphene (2024) | |
|---|---|---|---|
| Measures | Pressure and temperature | Pressure and temperature | Temperature, with negligible response to pressure, humidity and bending |
| Sensing elements | 16 force-sensitive resistors and 8 thermistors per insole | Pressure and temperature gratings along one optical fibre, 5 of them for temperature | 10 laser-scribed graphene sensors per insole |
| Readout | Multiplexers, microcontroller and Bluetooth Low Energy | Optical interrogator over a wired connection | 16-channel multiplexer, TinyPico microcontroller and Bluetooth |
| Strengths | Off-the-shelf parts for about US$170 | Both quantities on one electrically safe fibre; development cost more than eight times lower than a commercial system | Thin, light and low-cost, with a linear response and about 0.1 °C precision |
| Limitations | Far fewer sensing points than the 960 of a commercial insole | Wired interrogator and far fewer sensing points than a commercial insole | Wire connections failed during running; long-term stability still under test |
Research stages and outputs
Electronic pressure and temperature sensing
Developed a wireless insole with 16 force-sensitive resistors and eight thermistors per foot, built from off-the-shelf parts for about US$170, with real-time pressure and temperature maps.
Fibre Bragg grating insole
Developed an optical sensing system to measure temperature and pressure together. The study compared the fibre-optic and electronic prototypes with a commercial plantar-pressure system.
Graphene sensing for temperature mapping
Laser-scribed graphene temperature sensors, ten per insole, mapped plantar temperature with a linear response and about 0.1 °C precision.
My contribution
As second author of the electronic insole study, I integrated the sensors and worked on the methodology, data acquisition, experiments, analysis and manuscript review. I led the fibre Bragg grating insole as first author, covering system development, data acquisition and analysis, validation against the electronic and commercial systems, and manuscript preparation. Both of these studies came from my senior design project. For the laser-induced graphene study I contributed to the experimental and technical assessment, interpretation of the findings and manuscript review.
Scope and validation
Each prototype was tested in controlled bench experiments and with healthy volunteers. Detecting ulcer onset would require longitudinal clinical validation with people with diabetes.
Next steps
Detecting ulcer onset will need longitudinal studies with people with diabetes.
Publications
- Design and Implementation of a Smart Insole System to Measure Plantar Pressure and TemperatureSensors · 2022
- Fiber Bragg Gratings based smart insole to measure plantar pressure and temperatureSensors and Actuators A: Physical · 2023
- Laser-Induced Graphene-Based Smart Insole to Measure Plantar TemperatureIEEE Sensors Journal · 2024