Applied machine learning · 2021
Machine learning analysis of COVID-19 vaccine attitudes in Qatar
A survey of 175 residents of Qatar, analysed with statistical tests, machine learning and dominance analysis to find what drives willingness and hesitancy toward COVID-19 vaccination.
Qatar University MSc course project
Approach
What makes residents of Qatar willing or hesitant to take the COVID-19 vaccine, and can their survey answers predict that attitude?
By early 2021 Qatar had approved COVID-19 vaccines and made its contact-tracing app, Ehteraz, mandatory in public spaces, yet some residents remained hesitant. Evidence on what drives willingness and hesitancy in the region was limited. This study surveyed residents of Qatar online in English and Arabic, tested how attitudes differed between groups, trained machine learning models to predict attitude from survey answers, and ranked the most influential factors with dominance analysis.
- Survey residents online
- Compare attitudes between groups
- Predict attitudes and rank factors
Surveying residents of Qatar
Journal of Human Behavior in the Social Environment · 2022
A short pilot with three participants and open-ended questions shaped the survey. A high health risk and the wish to travel favoured vaccination, while unknown long-term side effects held people back. One participant wanted clearer public information and to see leaders vaccinated first.
The main survey ran on Google Forms in English and Arabic, took 5 to 10 minutes and collected no identifying information. It asked about background, willingness and hesitancy on seven-point scales, and beliefs about past vaccines, religion, public figures, restrictions and the Ehteraz contact-tracing app. Of 175 respondents, 59 (33.71%) had already been vaccinated.
Willingness and hesitancy scores above 3 counted as willing or hesitant. Combining the two gave four attitude classes: willing and not hesitant, willing but hesitant, not willing and hesitant, and not willing and not hesitant.
- Respondents
- 175
- Already vaccinated
- 33.71%
- Survey answers used as predictors
- 19
| Vaccinated | Not vaccinated | |
|---|---|---|
| I am willing to take the vaccine | 7 | 5 |
| I have some doubts or hesitations about taking the vaccine | 4 | 3 |
| Past vaccines make me concerned about the COVID-19 vaccine | 3 | 3 |
| Taking the vaccine should be a personal choice if I follow safety procedures | 6 | 6 |
| Seeing public figures take the vaccine increases my willingness | 5 | 4 |
| My religious background makes me unwilling to take the vaccine | 2 | 2 |
| More willing if lockdown restrictions are reduced | 6 | 5 |
| More willing if Ehteraz shows a special colour for vaccinated people | 6 | 4 |
| More willing if I no longer have to use Ehteraz | 6 | 4 |
| More willing if I avoid home quarantine after travelling | 7 | 5 |
Comparing attitudes across groups
Descriptive statistics, ANOVA and t-tests
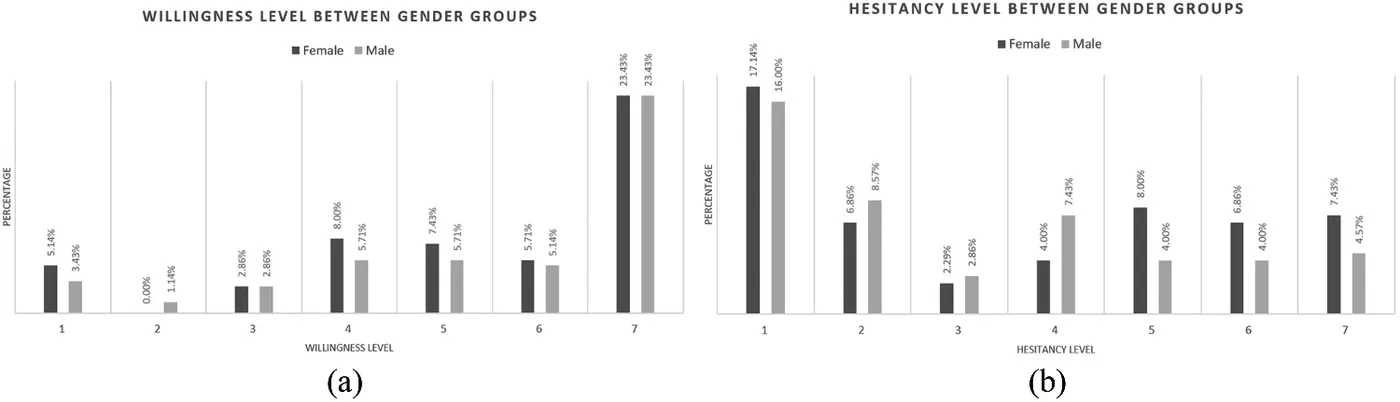
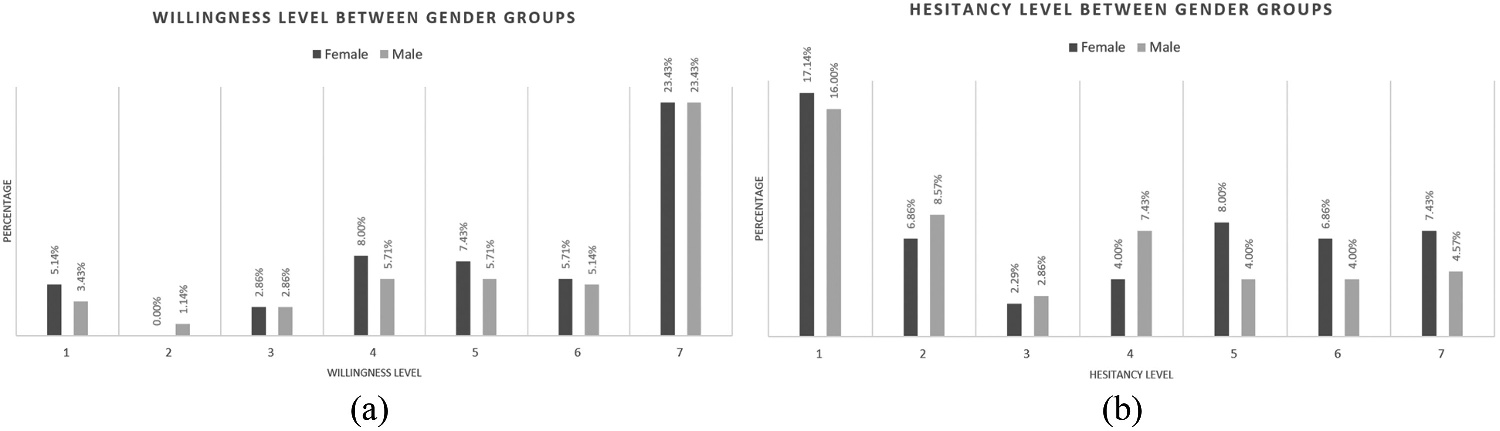
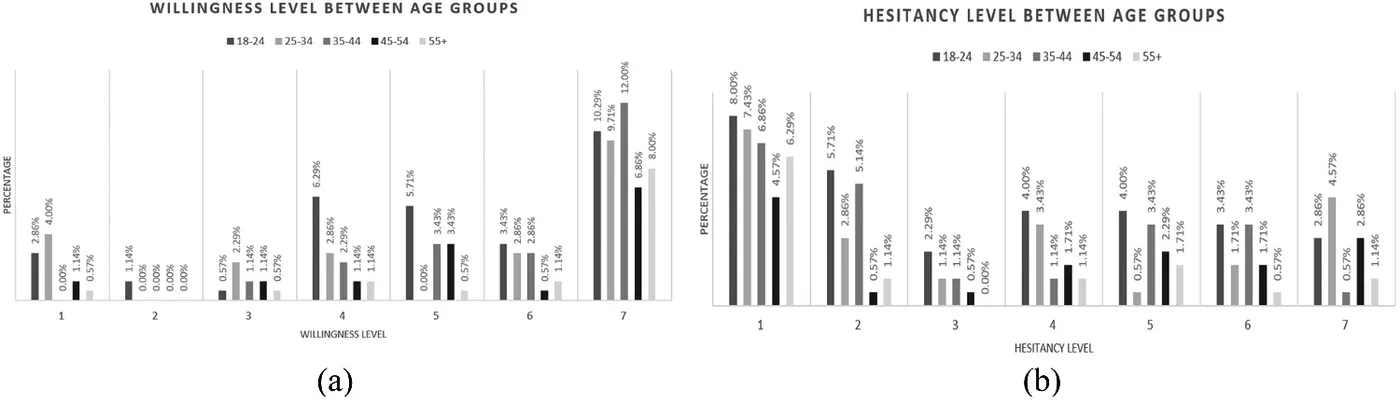
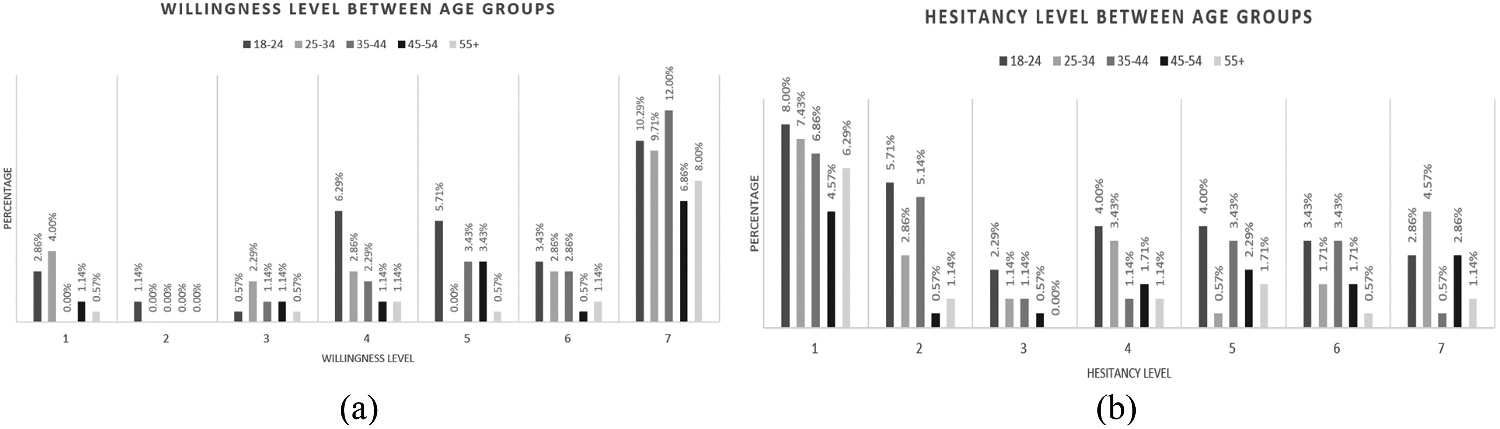
Willingness was high and hesitancy low for both women and men, and two-way ANOVA found no significant difference between them at the 95% confidence level. Younger respondents were the most willing and least hesitant.
Splitting respondents at age 45 showed that willingness differed significantly between those aged 18 to 44 and those 45 and over (two-tailed p < 0.001), while hesitancy did not (p = 0.87). Past flu vaccination showed no significant interaction with attitude, and religious affiliation was not linked to hesitancy.
These tests look at one factor at a time and cannot rank how much each answer contributes. That question was taken up with machine learning and dominance analysis.
- Willingness, ages 18–44 vs 45 and over
- p < 0.001
- Hesitancy, same age groups
- p = 0.87
- Confidence level for all tests
- 95%
Predicting attitude from survey answers
Machine learning
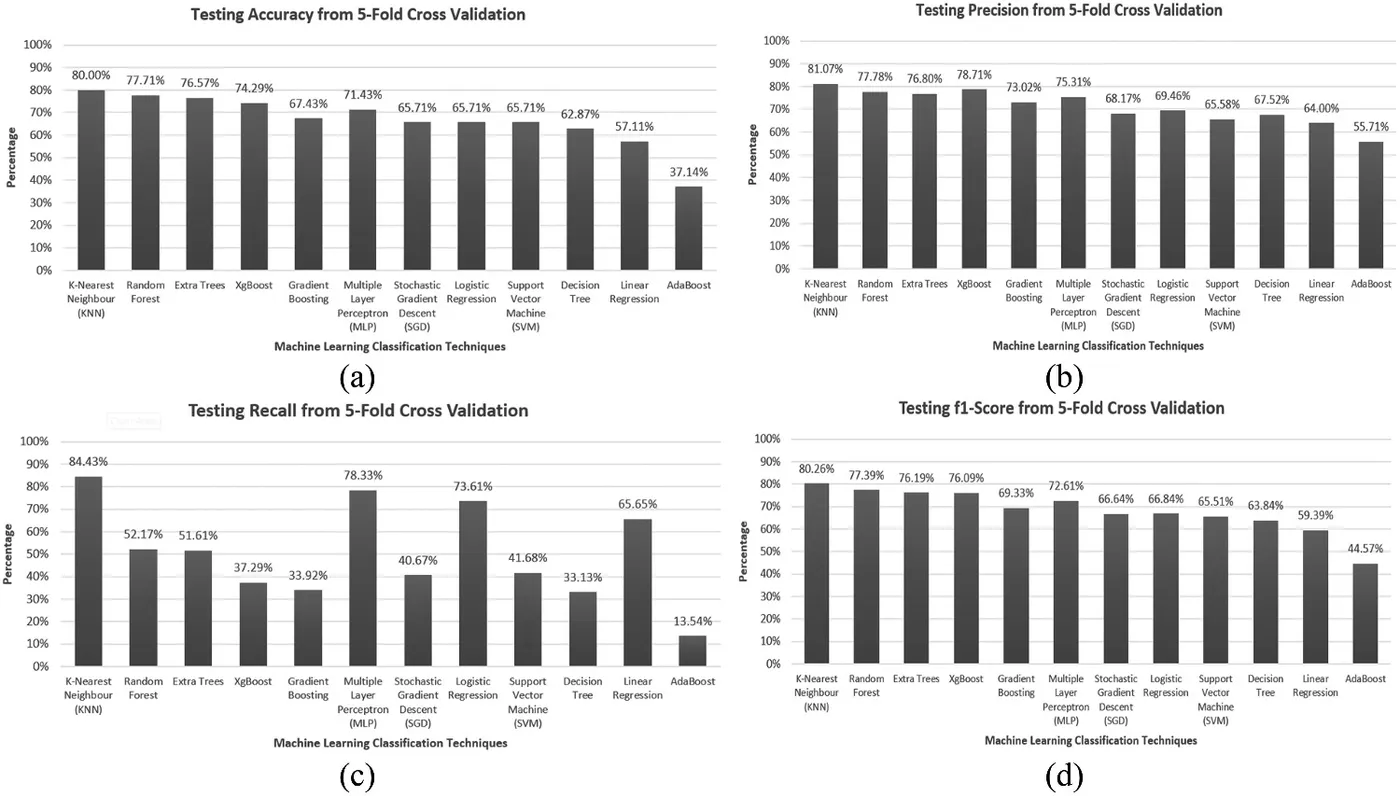
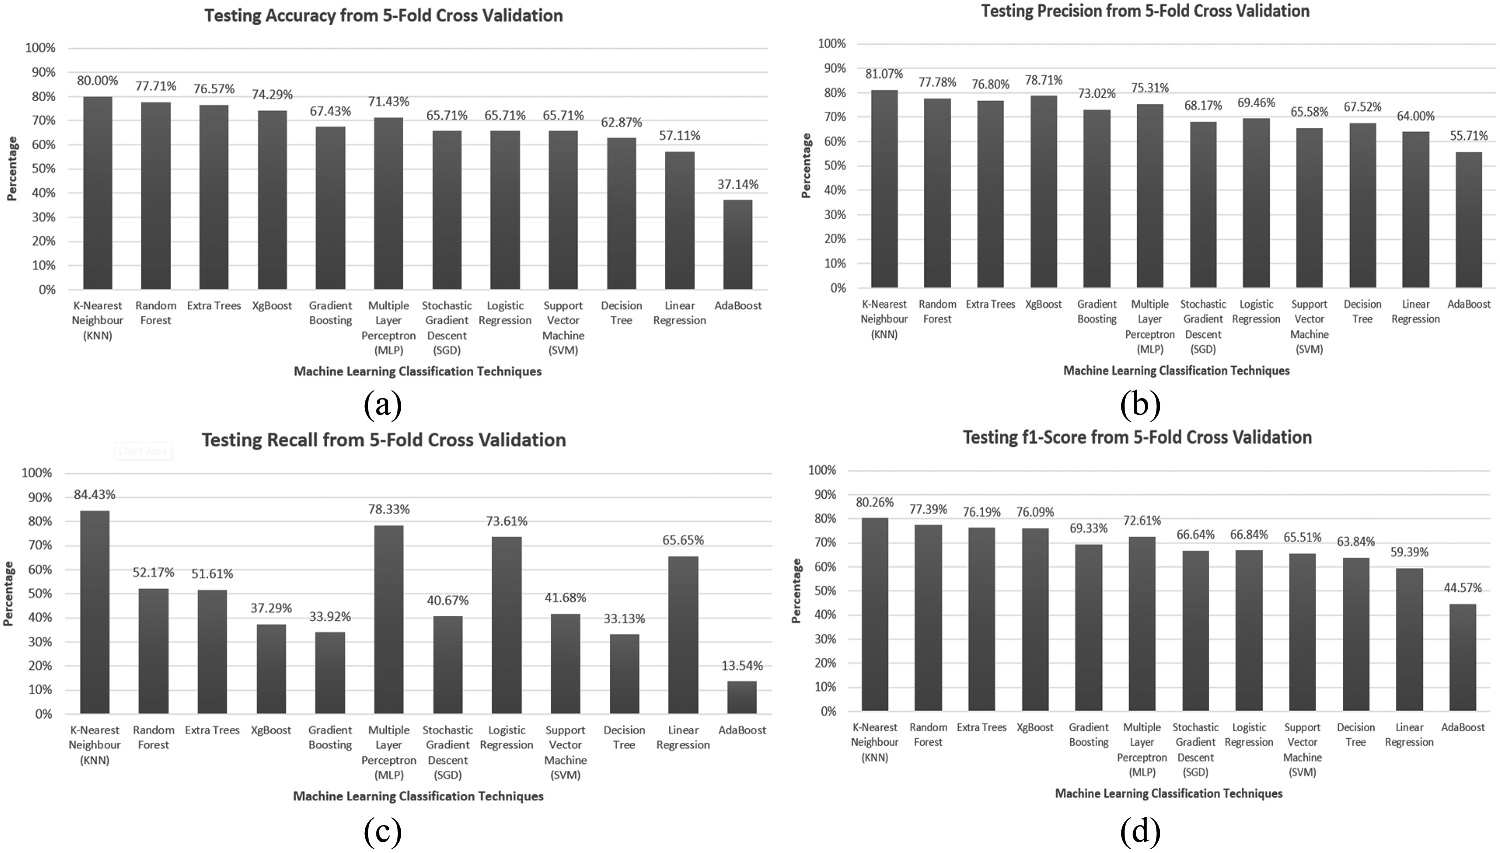
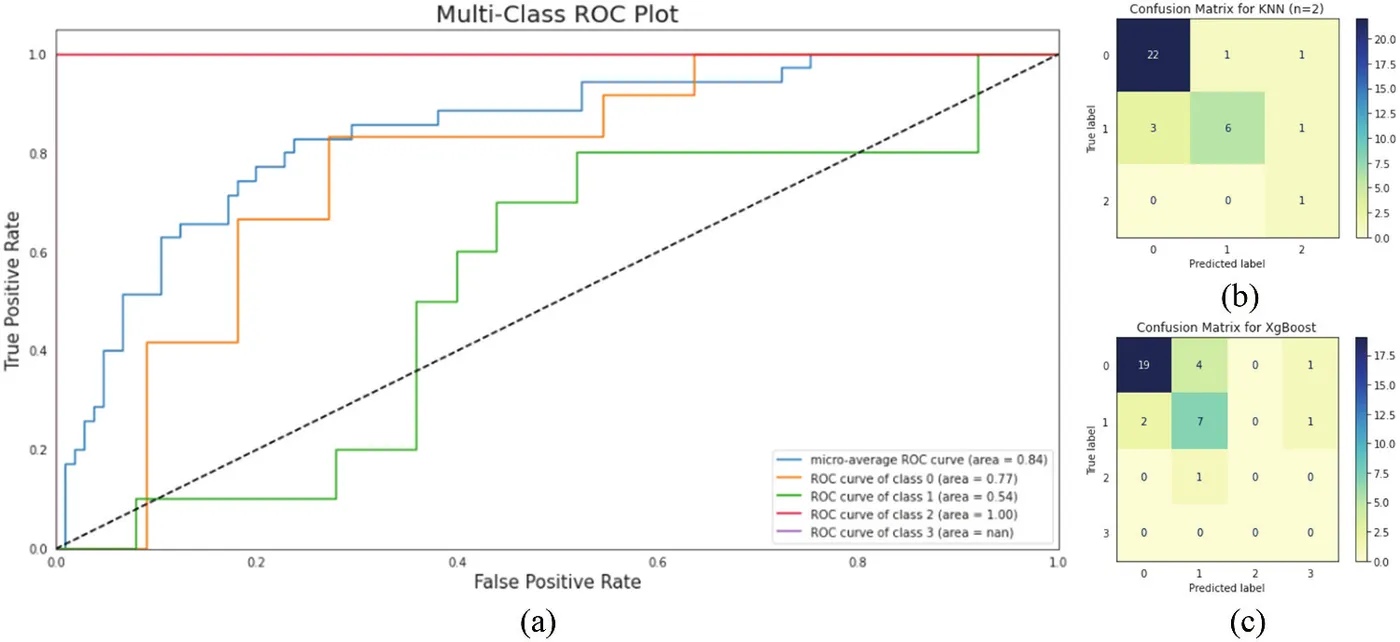
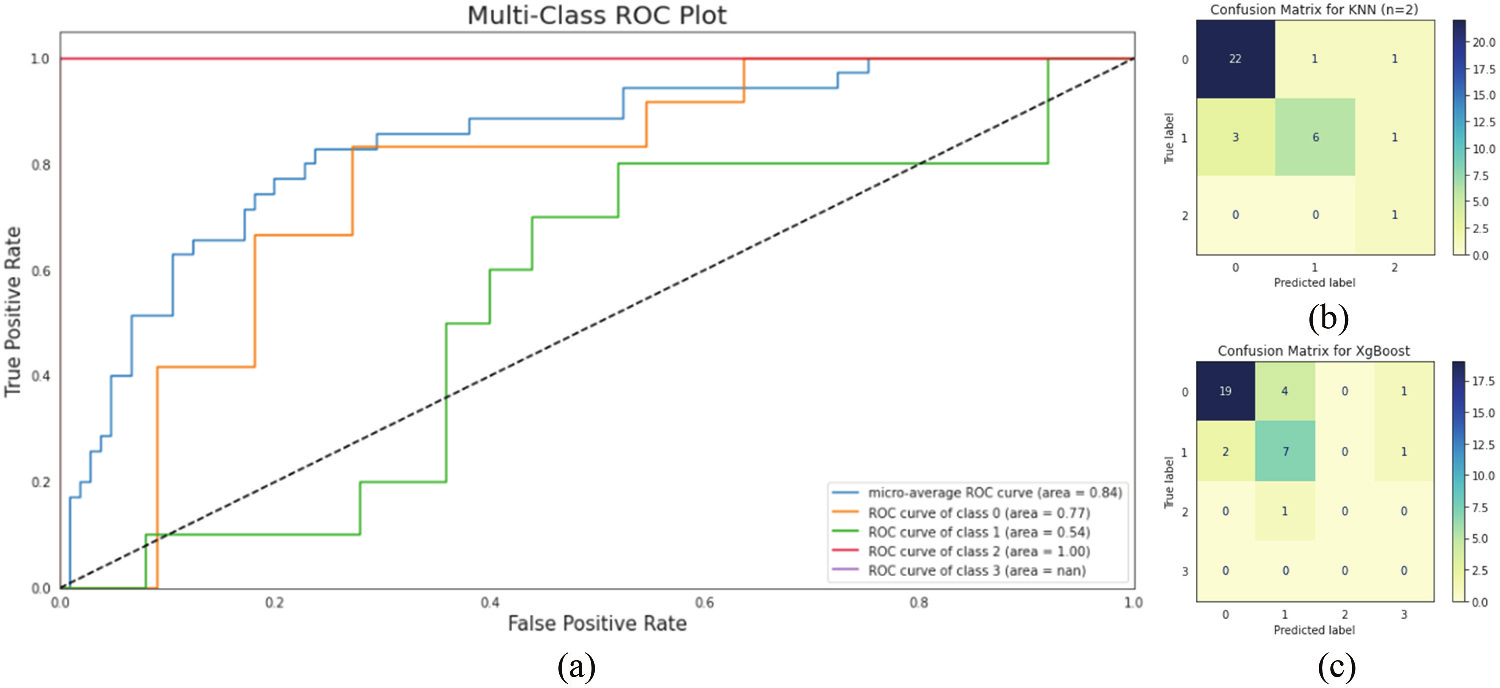
The 19 answers were encoded as 68 dummy variables, and twelve classifiers were compared in Python with five-fold cross-validation and an 80:20 split. The task was to predict each respondent’s attitude class. Ensemble and tree-based methods were the most stable, and random forest gave the lowest mean absolute error, 0.2057.
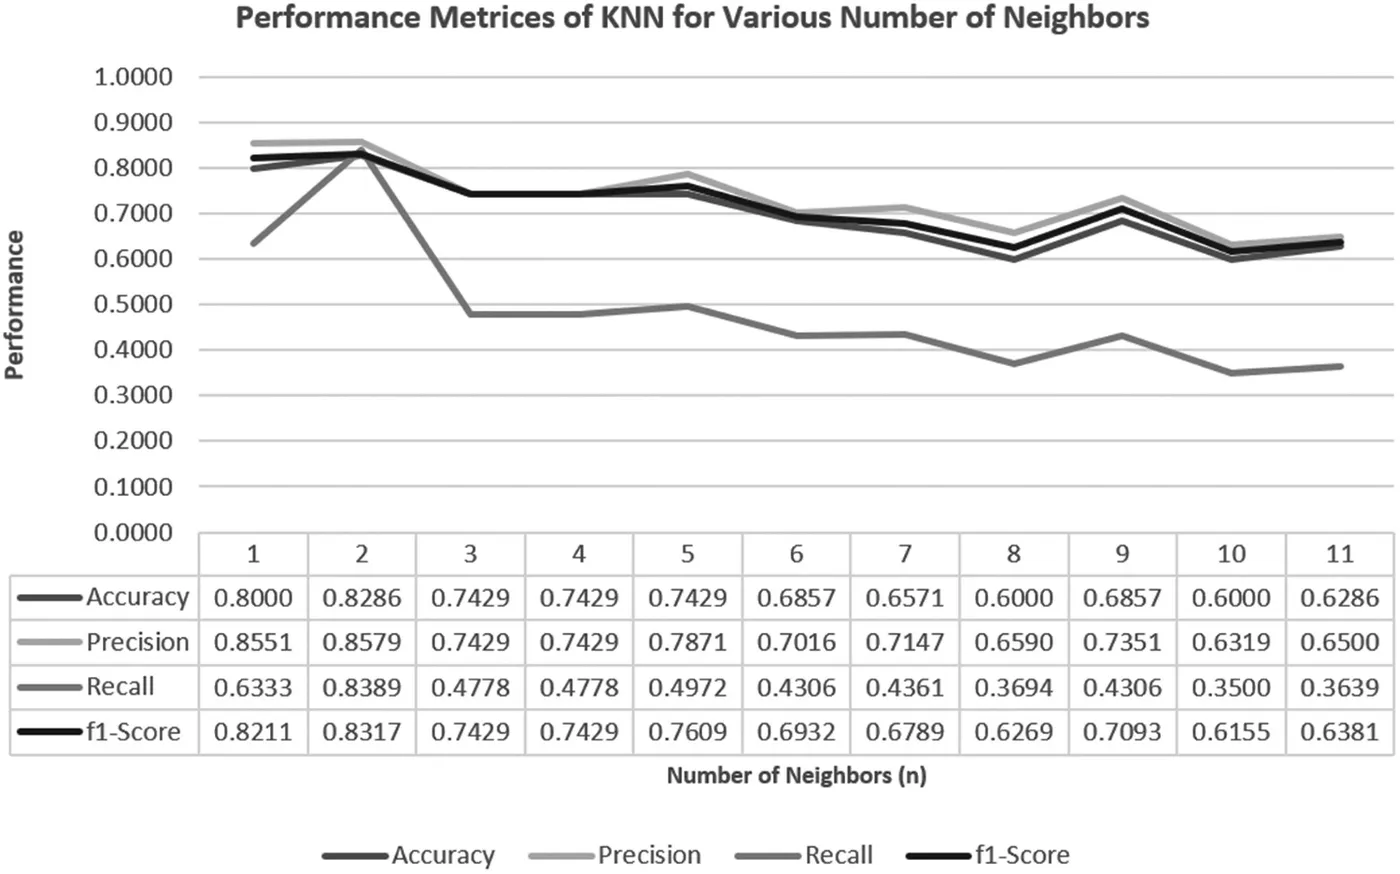
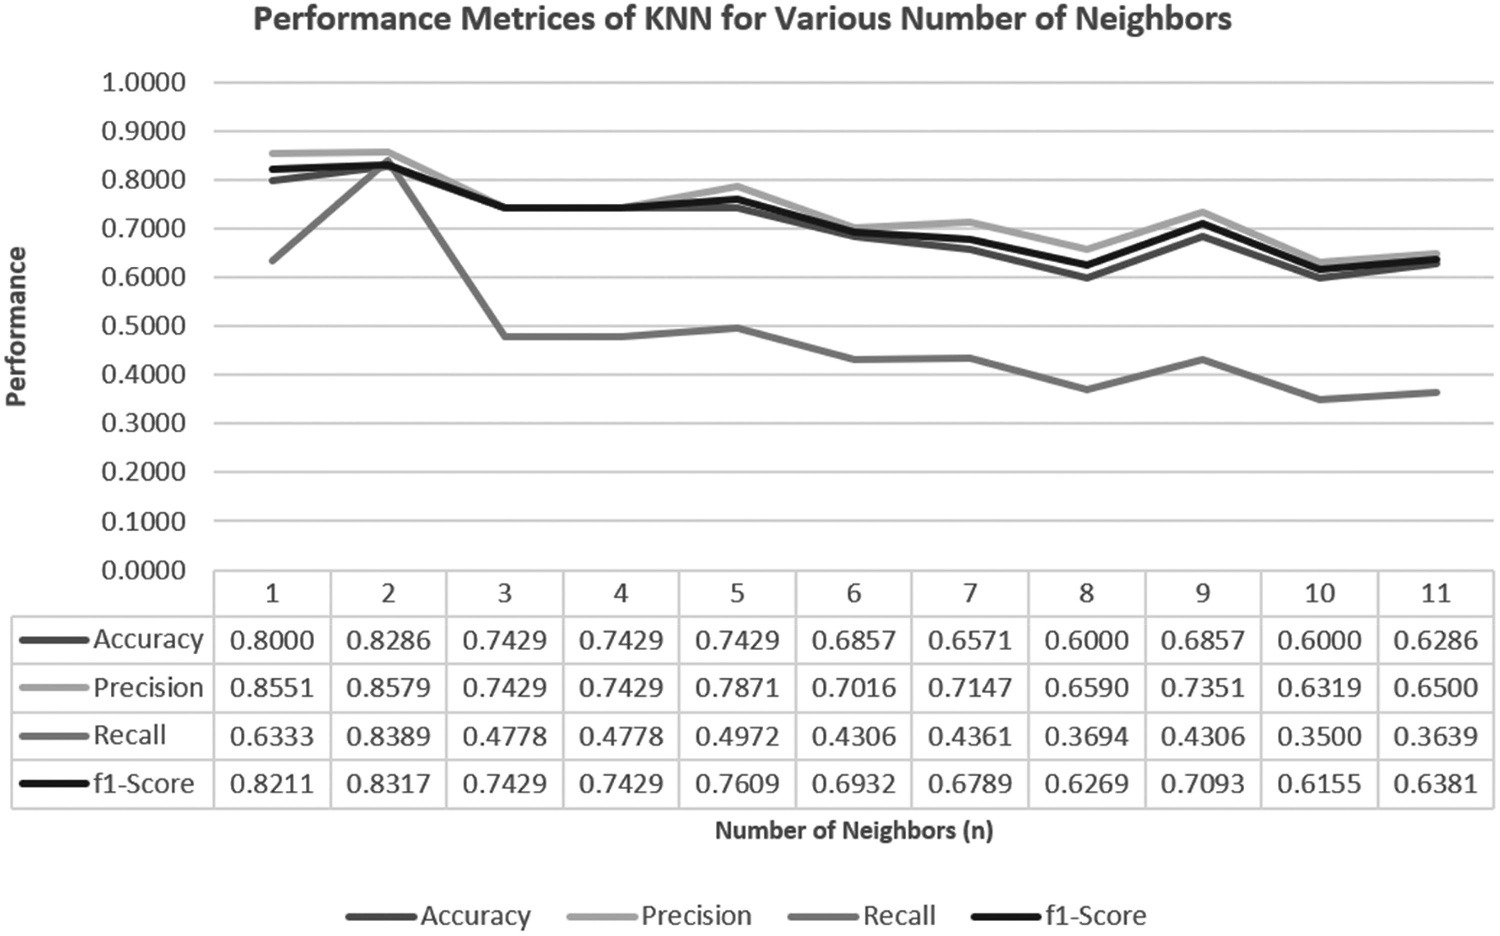
K-nearest neighbours had the best average across the four testing metrics, with 80.00% accuracy and 84.43% recall, while many other models had much lower recall. It worked best with two neighbours, which suggests the responses do not form large clusters.
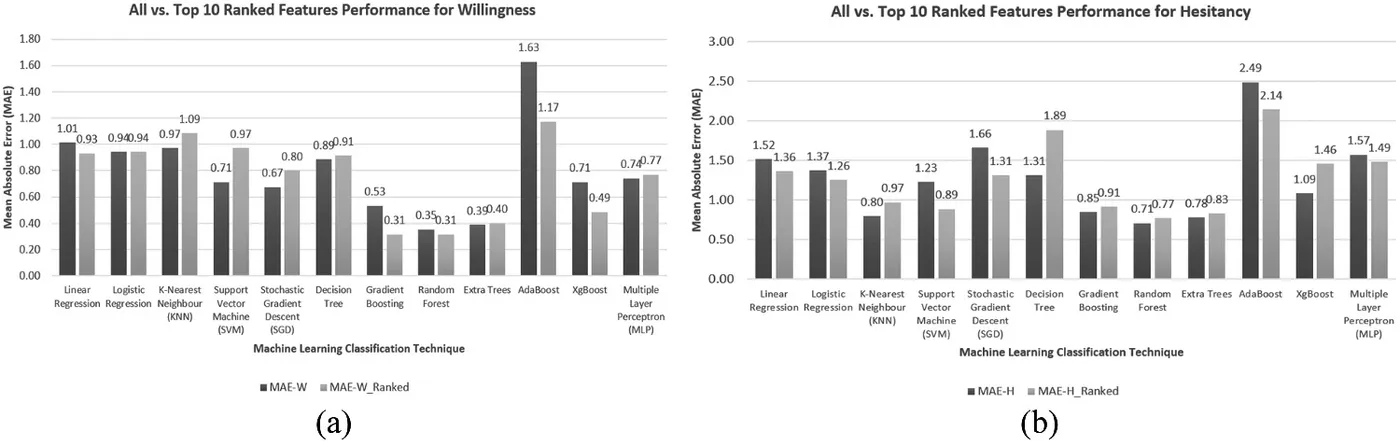
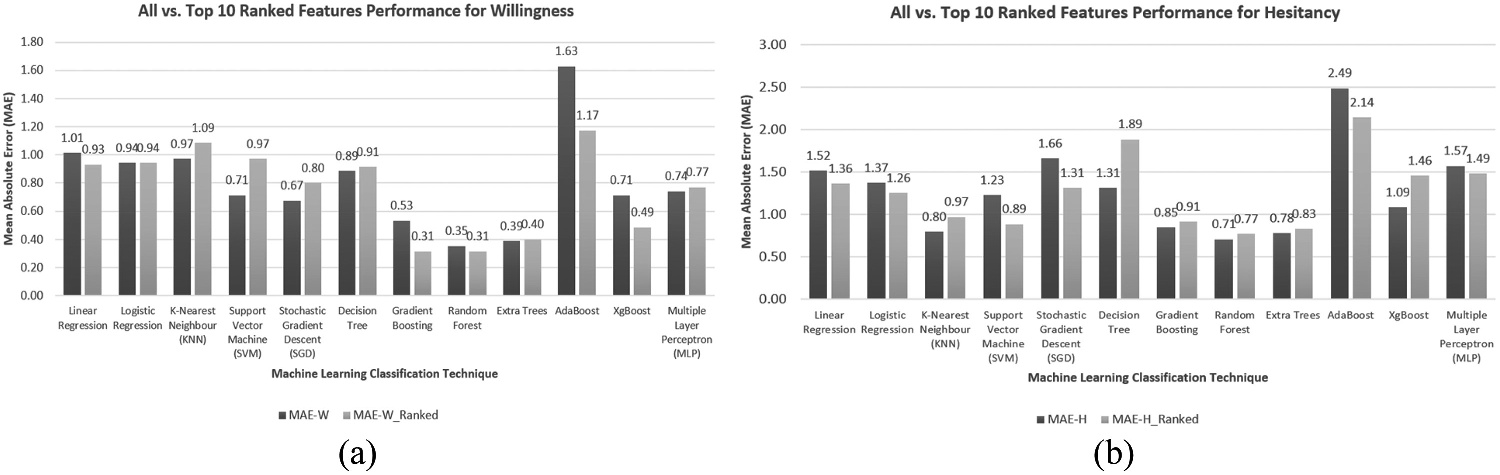
Predicting the seven-level scores directly was harder, and hesitancy was harder to predict than willingness. Random forest again performed best, with a mean absolute error of 0.35 for willingness and 0.71 for hesitancy.
- Accuracy with k-nearest neighbours
- 80.00%
- Classifiers compared
- 12
- Lowest mean absolute error (random forest)
- 0.2057
| Accuracy | Precision | Recall | F1 score | |
|---|---|---|---|---|
| K-nearest neighbours | 80.00 | 81.07 | 84.43 | 80.26 |
| Random forest | 77.71 | 77.78 | 52.17 | 77.39 |
| Extra trees | 76.57 | 76.80 | 51.61 | 76.19 |
| XGBoost | 74.29 | 78.71 | 37.29 | 76.09 |
| Multilayer perceptron | 71.43 | 75.31 | 78.33 | 72.61 |
| Logistic regression | 65.71 | 69.46 | 73.61 | 66.84 |
Ranking what drives willingness and hesitancy
Dominance analysis
Dominance analysis measured how much each answer explains, on its own, alongside all others and across subsets of them, and ranked the top 15 answers for willingness and for hesitancy.
Willingness was driven most by practical gains: avoiding home quarantine after travel, fewer lockdown restrictions and a special Ehteraz colour for vaccinated people, followed by seeing public figures vaccinated. Hesitancy was swayed most by seeing public figures vaccinated, followed by whether respondents had been vaccinated in Qatar, the view that vaccination should be a personal choice, and sex. Only a few of the many questions carried most of the weight.
Retraining on only the ten top-ranked answers lowered the willingness error for several models, including gradient boosting (0.53 to 0.31) and random forest (0.35 to 0.31).
- Relative importance of avoiding quarantine for willingness
- 23.4%
- Relative importance of public figures for hesitancy
- 31.1%
- Top factors ranked for each attitude
- 15
| Willingness | Hesitancy | |
|---|---|---|
| 1 | Avoiding home quarantine after travel (23.4%) | Seeing public figures vaccinated (31.1%) |
| 2 | Fewer lockdown restrictions (14.1%) | Whether vaccinated in Qatar (13.5%) |
| 3 | Special Ehteraz colour for vaccinated people (13.8%) | Vaccination as a personal choice (10.6%) |
| 4 | Seeing public figures vaccinated (12.1%) | Biological sex (8.2%) |
My contribution
I contributed to the quantitative and machine-learning analysis, interpretation, and manuscript preparation.
Study scope
The 175 respondents were recruited online rather than sampled at random, and their answers reflect attitudes around April 2021, when vaccines were newly available. Few respondents were unwilling but not hesitant, so that class could not be evaluated, and the factors found are associations rather than causes.
Publications
- COVID-19 vaccine willingness and hesitancy among residents in Qatar: a quantitative analysis based on machine learningJournal of Human Behavior in the Social Environment · 2022 (online 2021)
Code
- COVID-19-Vaccine-Willingness-and-Hesitancy-among-Residents-in-QatarResearch software and repository details