Intelligent energy systems · 2023–2024
Non-intrusive load and occupancy monitoring from smart-meter data
Recovering appliance-level electricity use from a single household meter, then using those appliance events to infer when a home is occupied.
Qatar University and Iberdrola Innovation Middle East · Iberdrola grant QUEX-CENG-IBERDROLA-23/24-2 · Published studies and a study under revision
Approach
Can one household smart meter show both how individual appliances are used and when a home is occupied, without extra sensors in the home?
Appliance-level monitoring usually needs a plug sensor on every device, and occupancy sensing often relies on cameras, motion sensors or Wi-Fi. This project instead uses the aggregate signals a household smart meter already records. It began with a method that reconstructs each appliance’s power profile, then used the reconstructed appliance activity to detect occupancy, first through multimodal feature fusion and then within one cascaded framework. All three studies use the public Electricity Consumption & Occupancy (ECO) dataset.
- Disaggregate appliance loads
- Convert loads to household events
- Classify occupancy
Reconstructing appliance load profiles from aggregate meter data
Under revision
Appliances leave very different traces in a household meter. Fridges and freezers cycle continuously, kettles and microwaves draw short bursts of high power, and laptops, lamps and entertainment systems use little power for long periods. Low-power devices are the hardest to separate because larger loads mask them, yet they are often closely linked to whether someone is at home.
The first study, SM-DAGG, reconstructs the continuous power profile of each appliance with its own one-dimensional sequence-to-sequence network. The inputs are the total power and the phase power and current channels most correlated with the target appliance. Its DAGG-Net architecture adds full-scale connections between encoder stages to nested skip pathways and deep supervision, so deeper layers combine patterns from several time scales.
The study also proposes the Jaccard of Energies of Interest (JEOI). It combines overlapping, missing and extra energy into one score and complements standard error and correlation measures. Methods were compared across 14 appliances from six ECO households.
- Appliance types
- 14
- Households
- 6
- Meter input channels per model
- 3
| Appliances | Disaggregation challenge | |
|---|---|---|
| High-energy | Dishwasher, kettle, stove, dryer, kitchen appliances, washing machine, microwave | Distinct signatures, but short and irregular use |
| Cyclic | Fridge, freezer | Regular cycles that continue whether or not anyone is home |
| Low-power | Air exhaust, entertainment, lamp, laptop, PC and router | Weak signatures masked by larger loads, but closely tied to occupant activity |
Fusing appliance events, load statistics and time for occupancy detection
Building and Environment · 2025
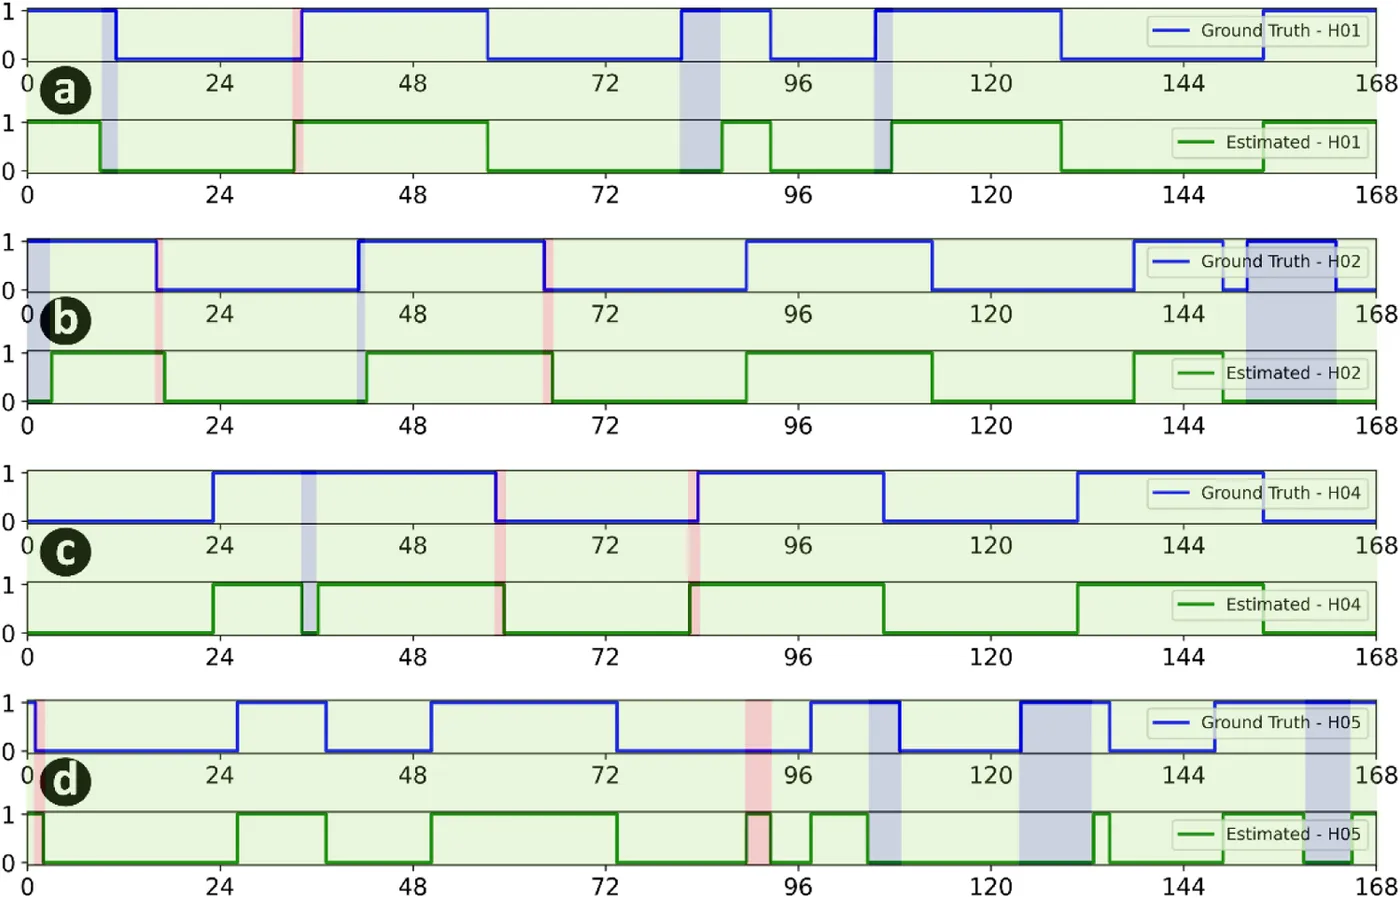
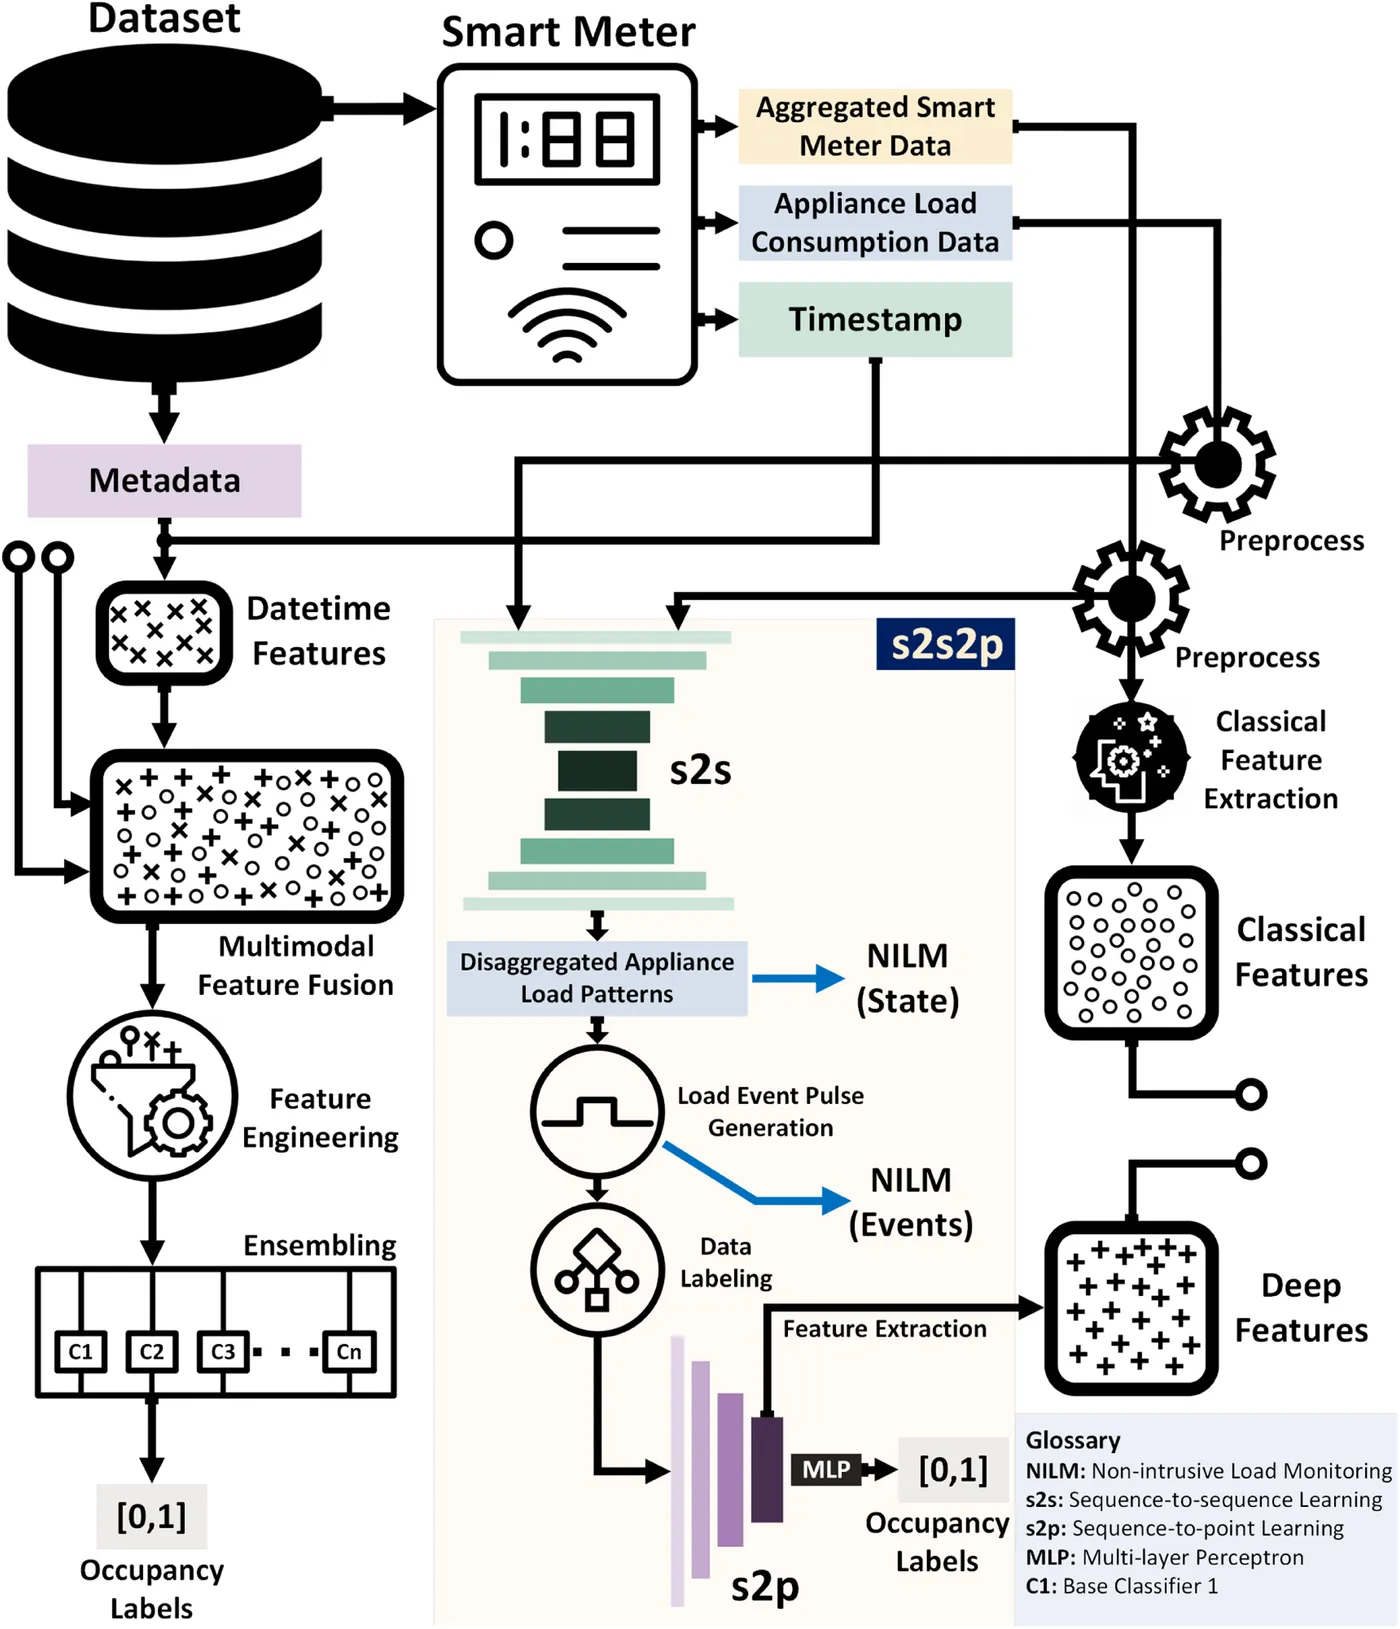
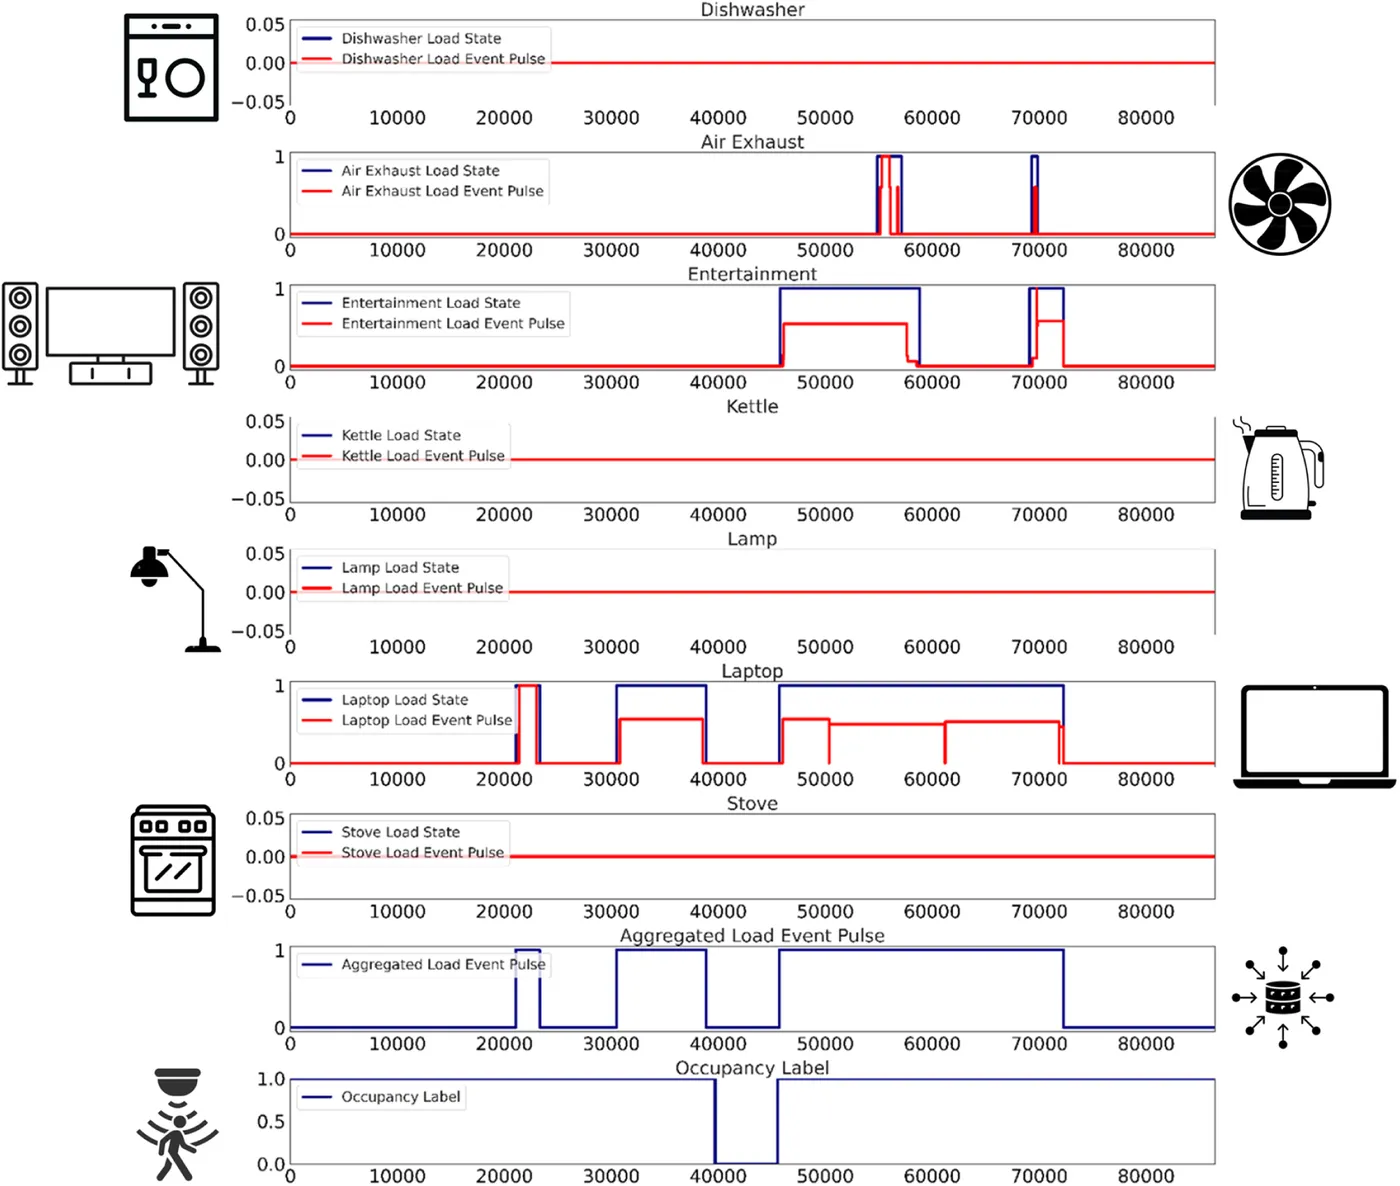
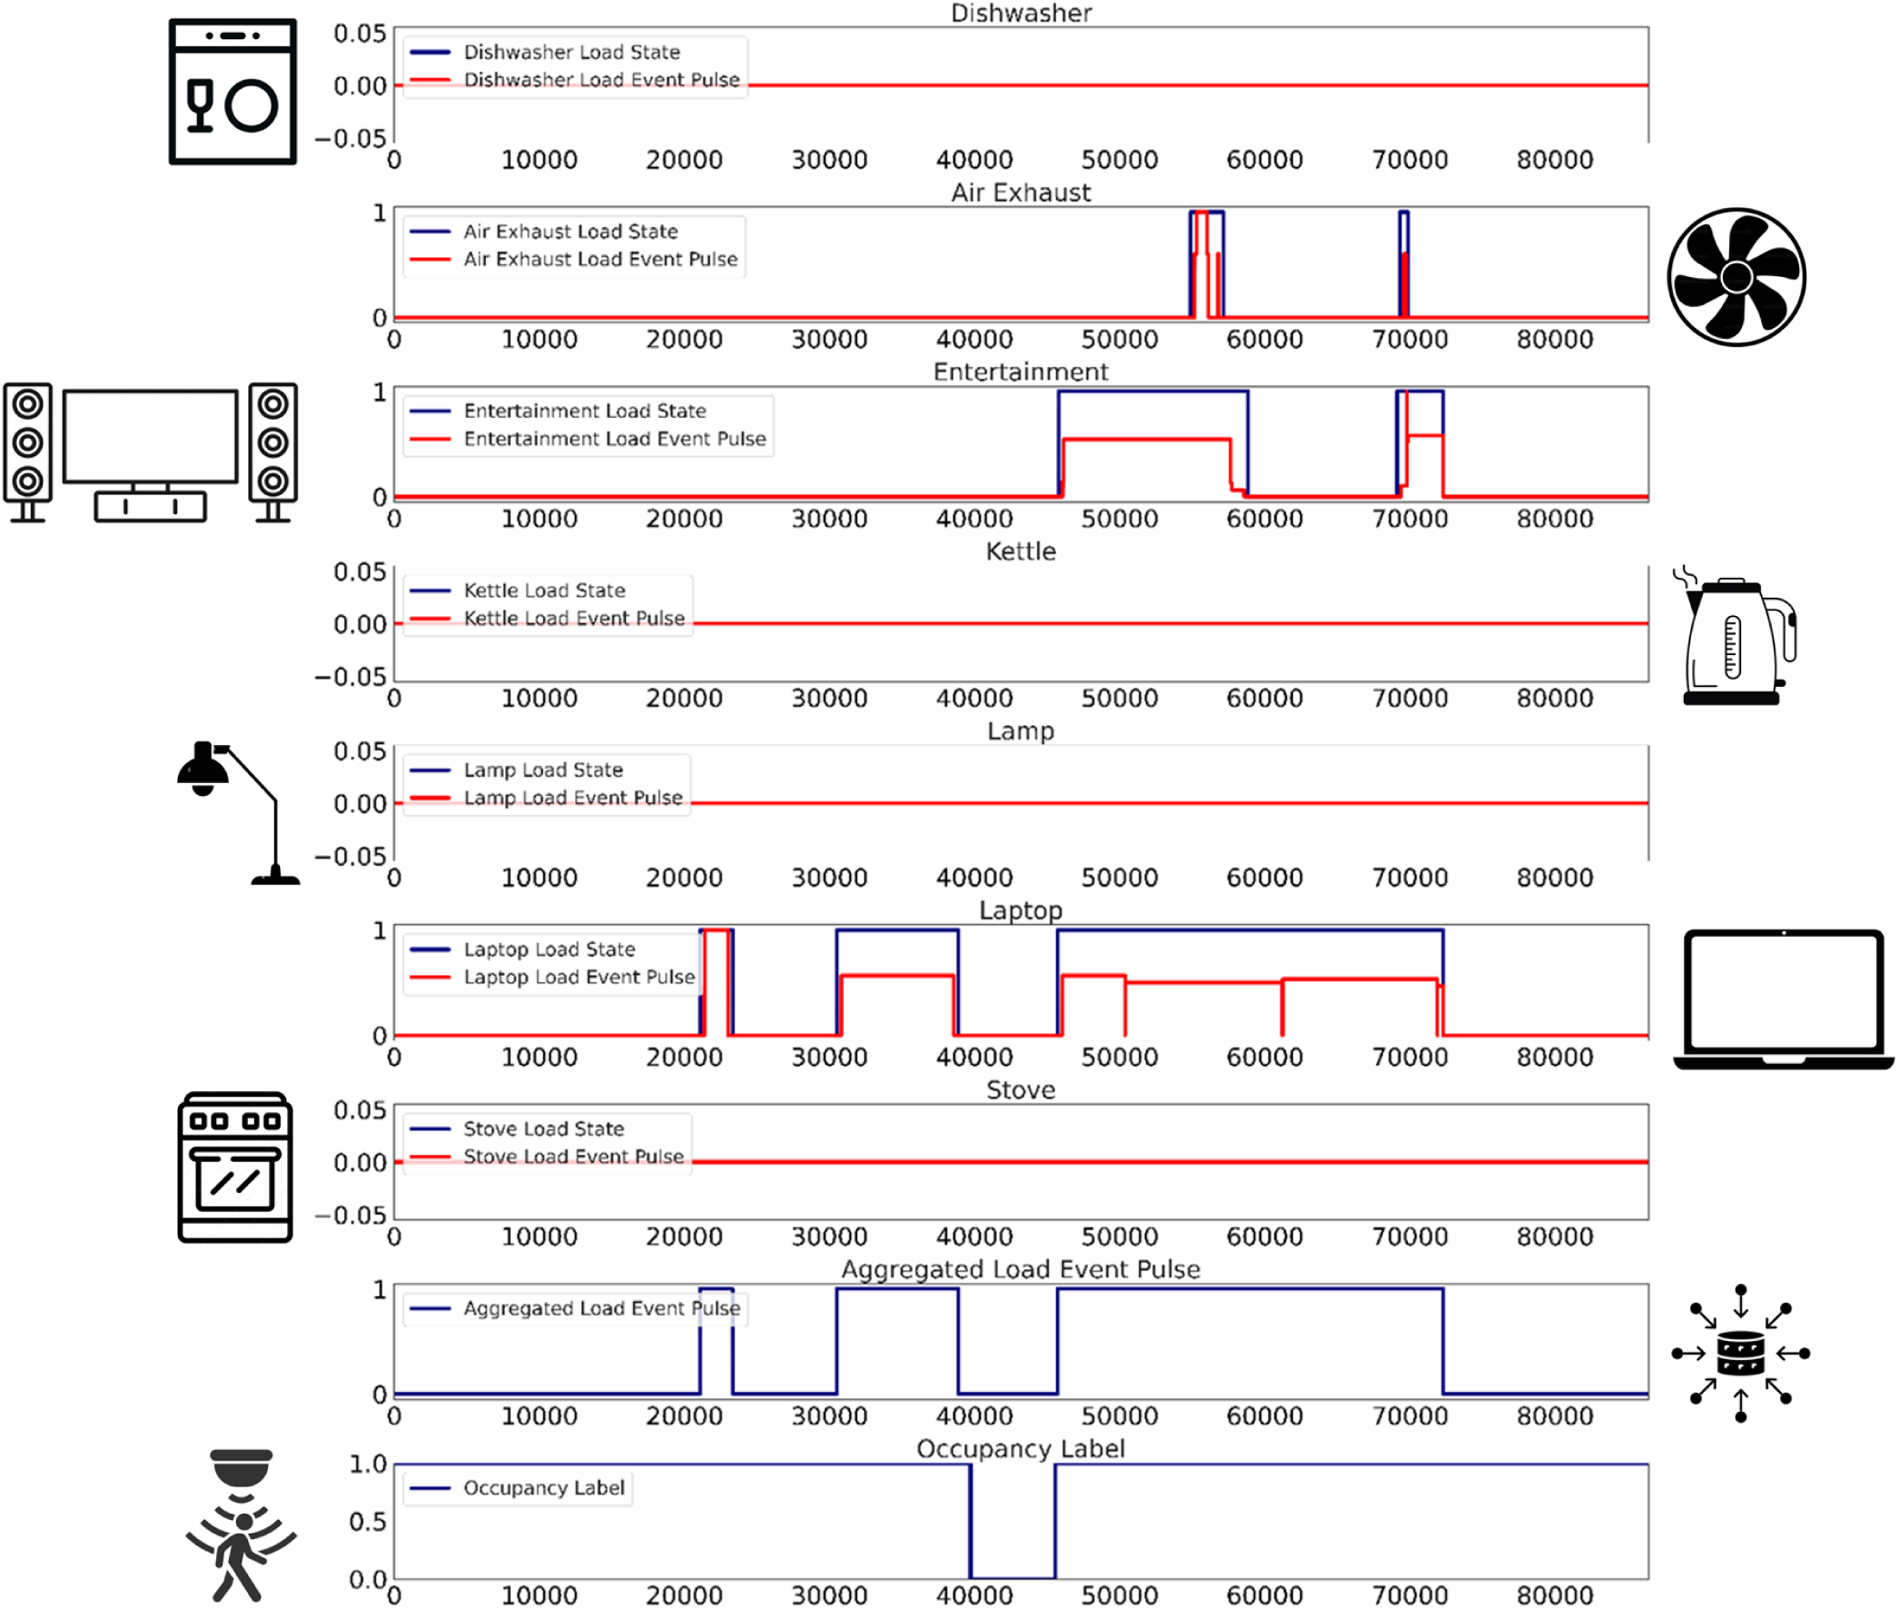
The second study, MMF-NIOM, used DAGG-Net to disaggregate the meter signal, then turned each reconstructed appliance profile into an on/off event pulse. Merging the pulses of all devices in a home gave one household activity signal. A deep classifier, NIOM-Net, used this signal to detect occupancy and to produce 256 learned features.
Appliance events alone do not show how much power is drawn or when. The framework therefore added 243 statistical, spectral and entropy features from the aggregate meter data and eight date and time features such as season, month, day and hour. After redundant features were removed and the most informative ones selected with a genetic algorithm, an ensemble of classical classifiers made the final decision.
Reconstruction quality varied by appliance. DAGG-Net reached JEOI scores of 0.961 for the dryer and 0.903 for the dishwasher, but 0.410 for the low-power air exhaust. In occupancy detection, the dishwasher and the entertainment system were the most informative single devices. Removing the lamp and the PC and router, whose use was less tied to presence, improved every metric.
- Occupancy accuracy
- 91.51%
- Specificity
- 91.99%
- Fused features before selection
- 507
| Accuracy | F1 score | Specificity | |
|---|---|---|---|
| Load-event features, nine devices | 85.75% | 85.74% | 86.32% |
| Fused features, nine devices | 88.47% | 88.48% | 89.00% |
| Load-event features, seven devices | 88.22% | 88.21% | 88.96% |
| Fused features, seven devices | 91.51% | 91.52% | 91.99% |
One framework for appliance loads and occupancy
Journal of Building Engineering · 2025
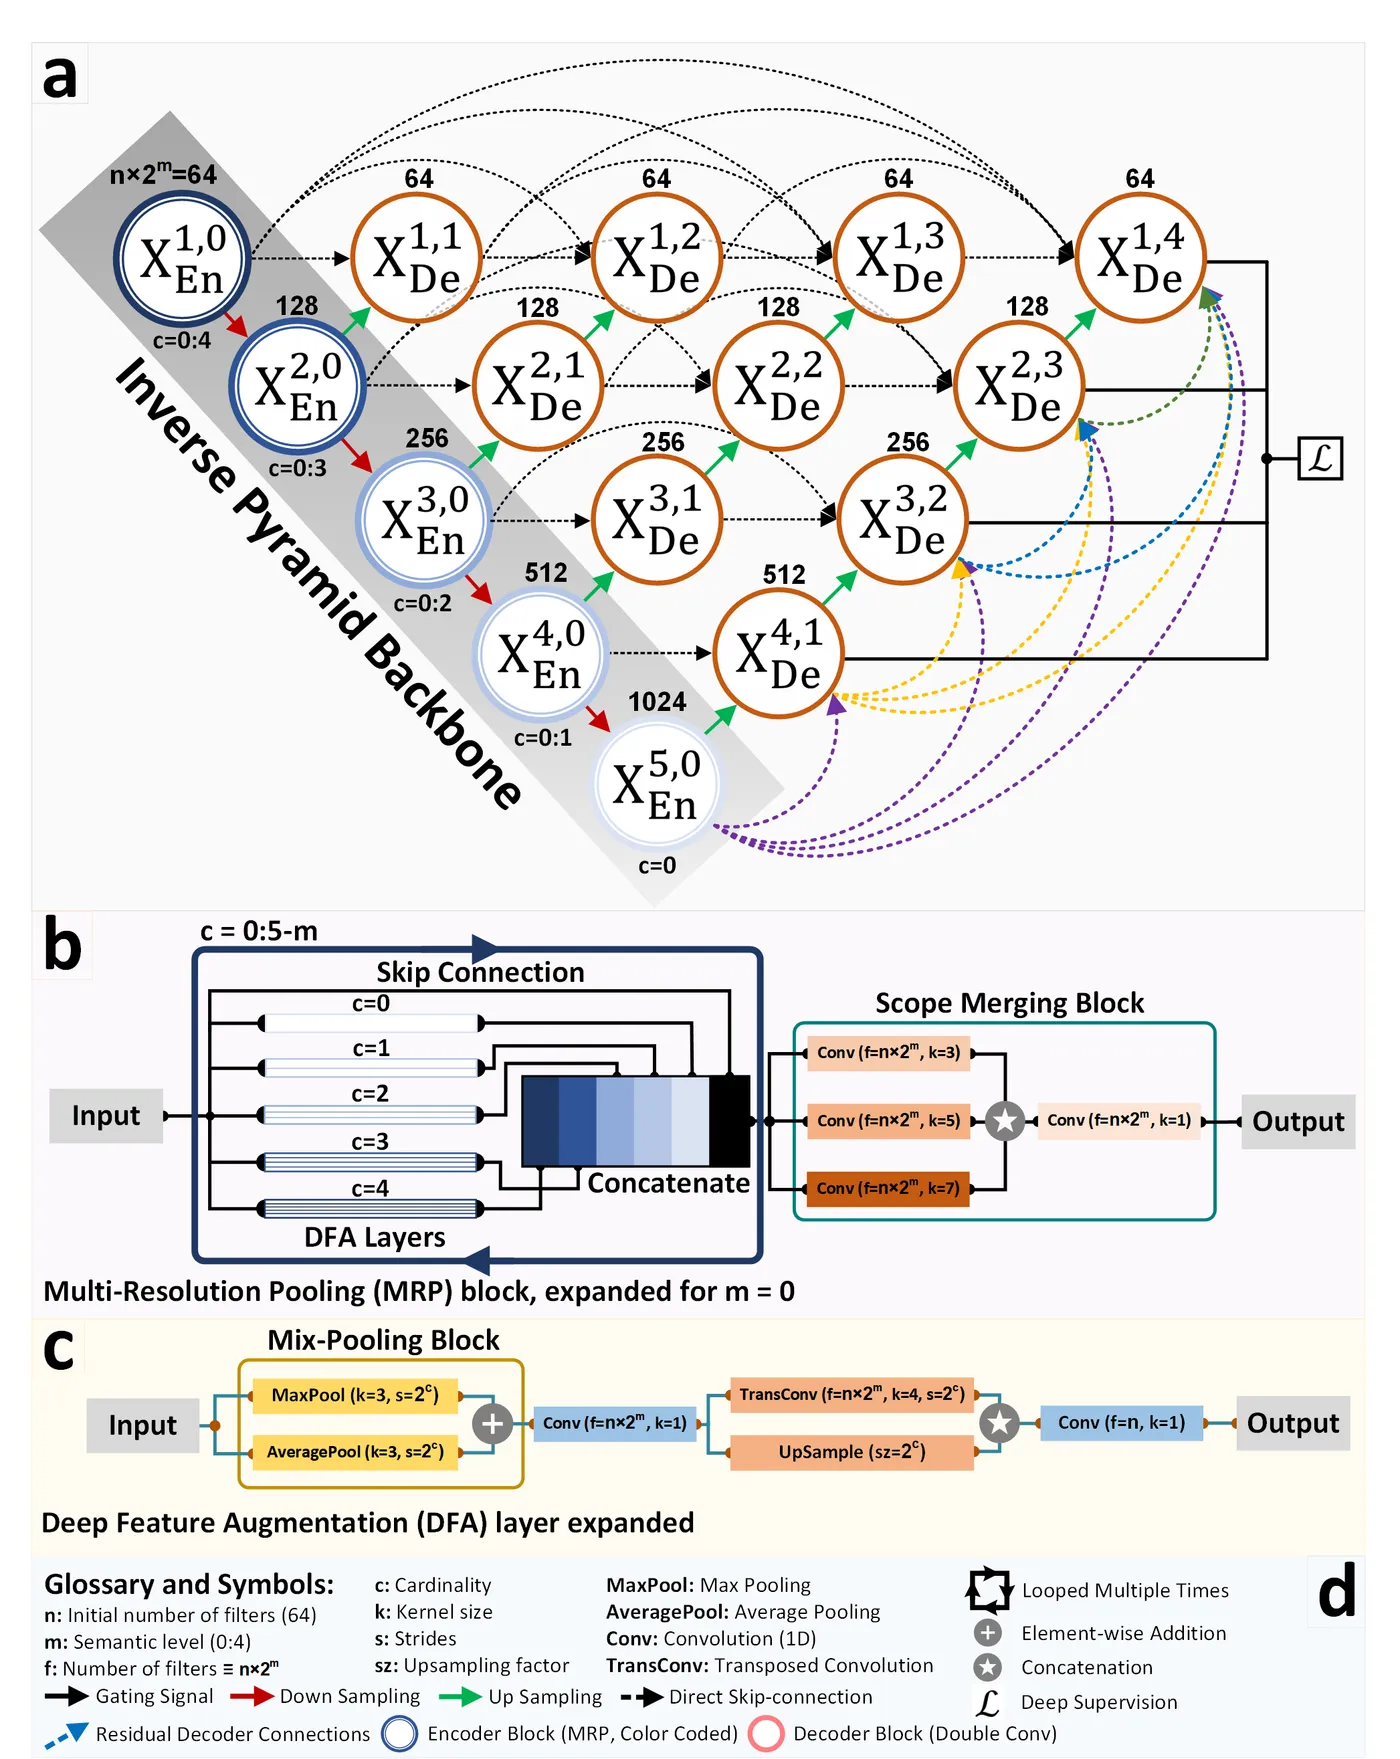
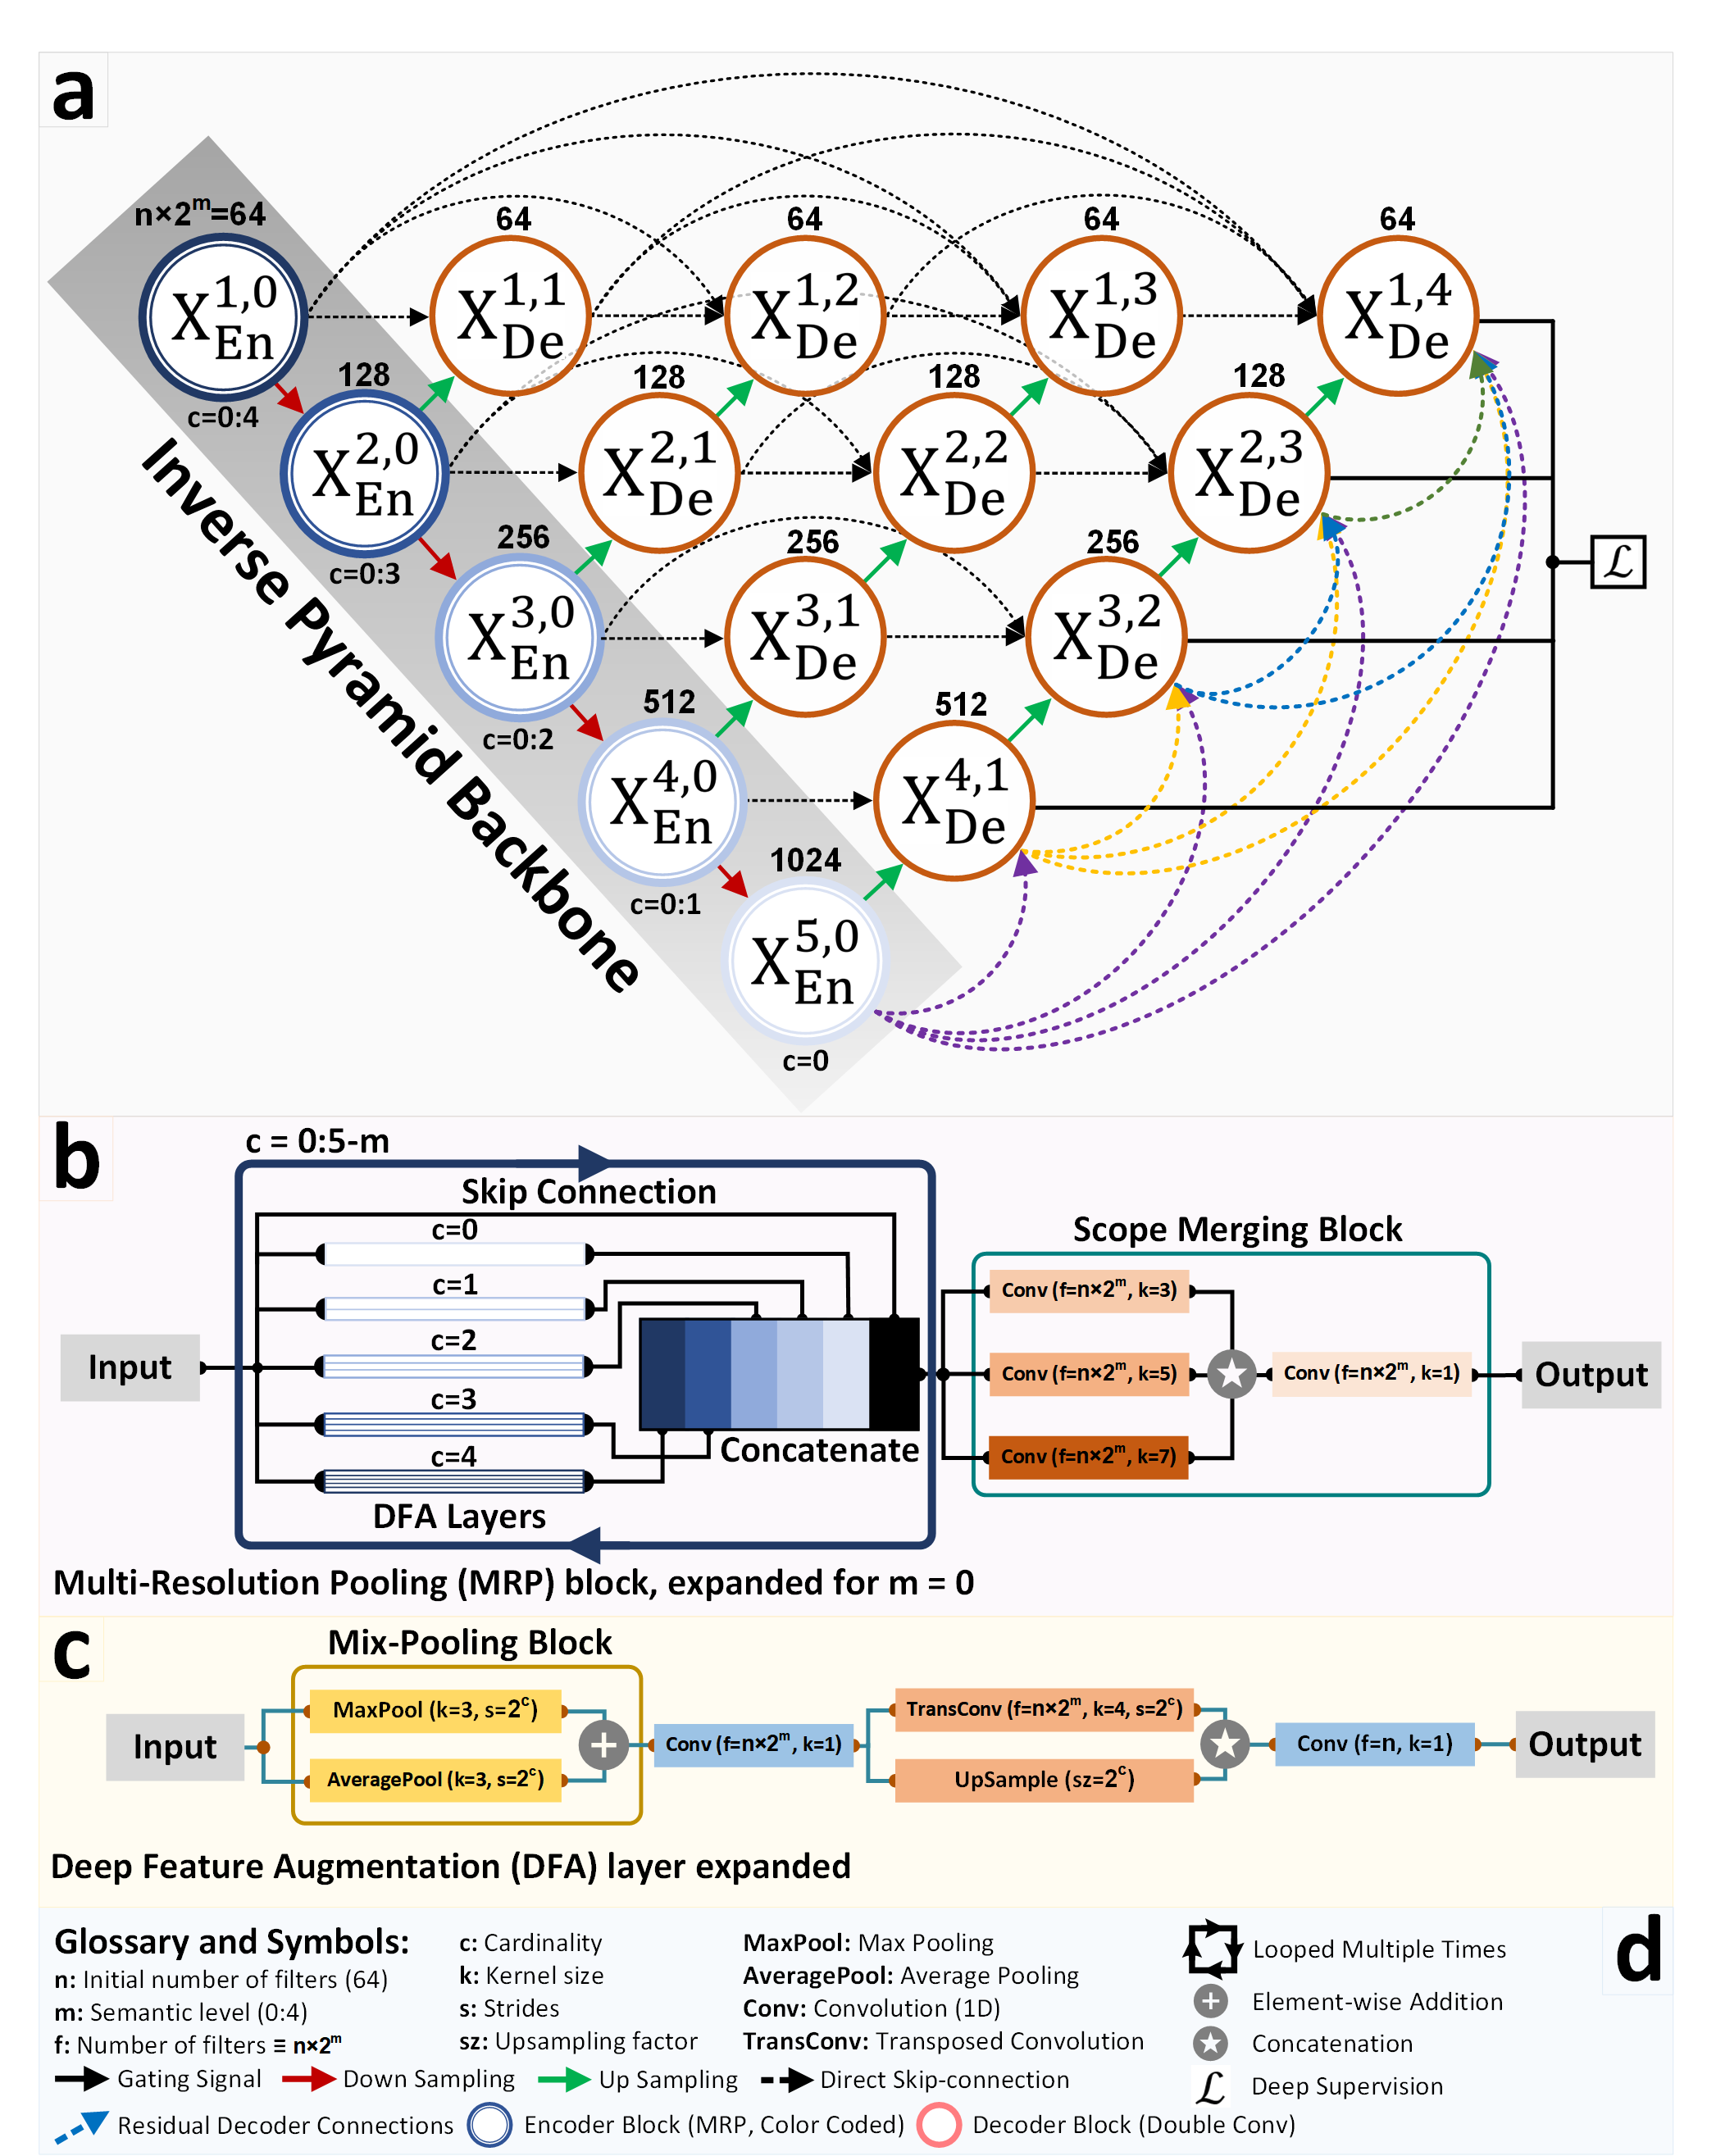
The third study, NILOM, joined the two tasks in one cascaded deep learning framework. Its first network, LD-Net, reconstructs appliance load profiles. Its second, OD-Net, classifies occupancy in 30-minute windows from the household event pulse, so the same meter data yields both appliance use and occupancy.
LD-Net uses an inverse-pyramid encoder built from multi-resolution pooling blocks, with nested and full-scale decoder connections. It outperformed UNet, UNet++, UNet3+ and PSP-Net trained under the same settings, particularly for low-power devices such as laptops and PCs. The study also introduced the Dice of Energies of Interest (DEOI), a Dice-based counterpart to JEOI, which exposed load mismatches that correlation alone missed.
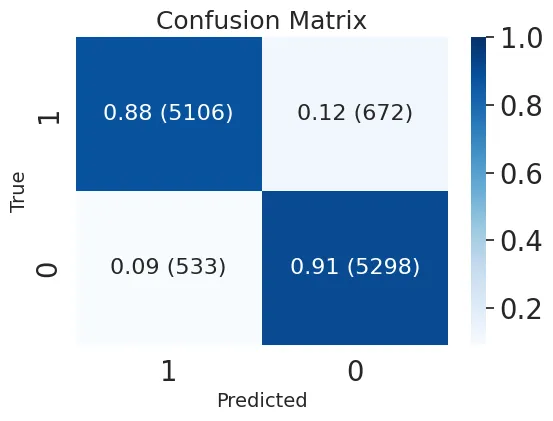
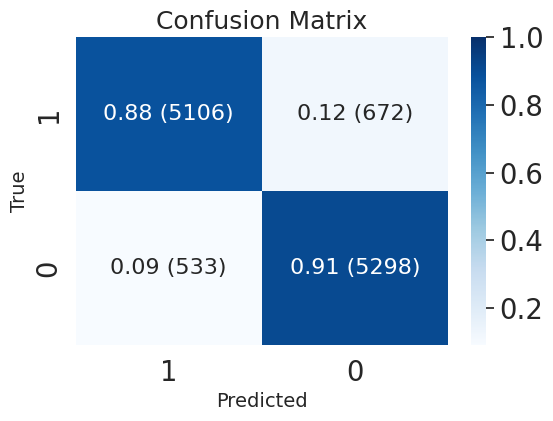
Disaggregating first made a large difference. Classifying occupancy directly from the aggregate meter signal reached 61.35% accuracy, whereas every single-appliance event pulse did better, up to 93.49% for the dishwasher. Combining several devices is more robust to varied routines than relying on one appliance. Keeping only devices with at least 5% correlation to occupancy raised accuracy from 85.72% to 89.62% on held-out households.
- Occupancy accuracy on held-out households
- 89.62%
- Hours of labelled data evaluated
- 5,805
- Reported inference time for both networks
- 47 ms
| Accuracy | F1 score | Specificity | |
|---|---|---|---|
| Aggregate meter signal, no disaggregation | 61.35% | 60.88% | 62.68% |
| All selected appliances | 85.72% | 85.63% | 86.89% |
| Appliances with at least 5% occupancy correlation | 89.62% | 89.45% | 90.86% |
| Best single appliance (dishwasher) | 93.49% | 93.34% | 92.82% |
My contribution
I led all three studies, including study design, data curation, model development, validation, analysis, visualisation and manuscript drafting, as part of the Qatar University–Iberdrola collaboration.
Study scope
All results come from the ECO dataset, which covers six households over about eight months, with occupancy labels for two months in five of them. Evaluation used held-out days or households within this dataset, so performance in new homes, with other meters and in streaming use remains to be established. Results from the disaggregation study under revision are not reported here.
Publications
- A cascaded deep learning framework for simultaneous non-intrusive load and occupancy monitoring using multi-channel aggregated smart meter dataJournal of Building Engineering · 2025
- Multimodal feature fusion and ensemble learning for non-intrusive occupancy monitoring using smart metersBuilding and Environment · 2025
Code
- NILOMResearch software and repository details