Physiological signal processing · 2023
Deep learning for cerebral blood-flow analysis using transcranial Doppler
Deep learning methods that restore transcranial Doppler flow-velocity waveforms and distinguish healthy volunteers from patients in neurocritical care.
QSCare · Qatar University High Impact Grant QUHI-CENG-22/23-548
Approach
Can middle cerebral artery flow-velocity waveforms distinguish healthy volunteers from patients in neurocritical care?
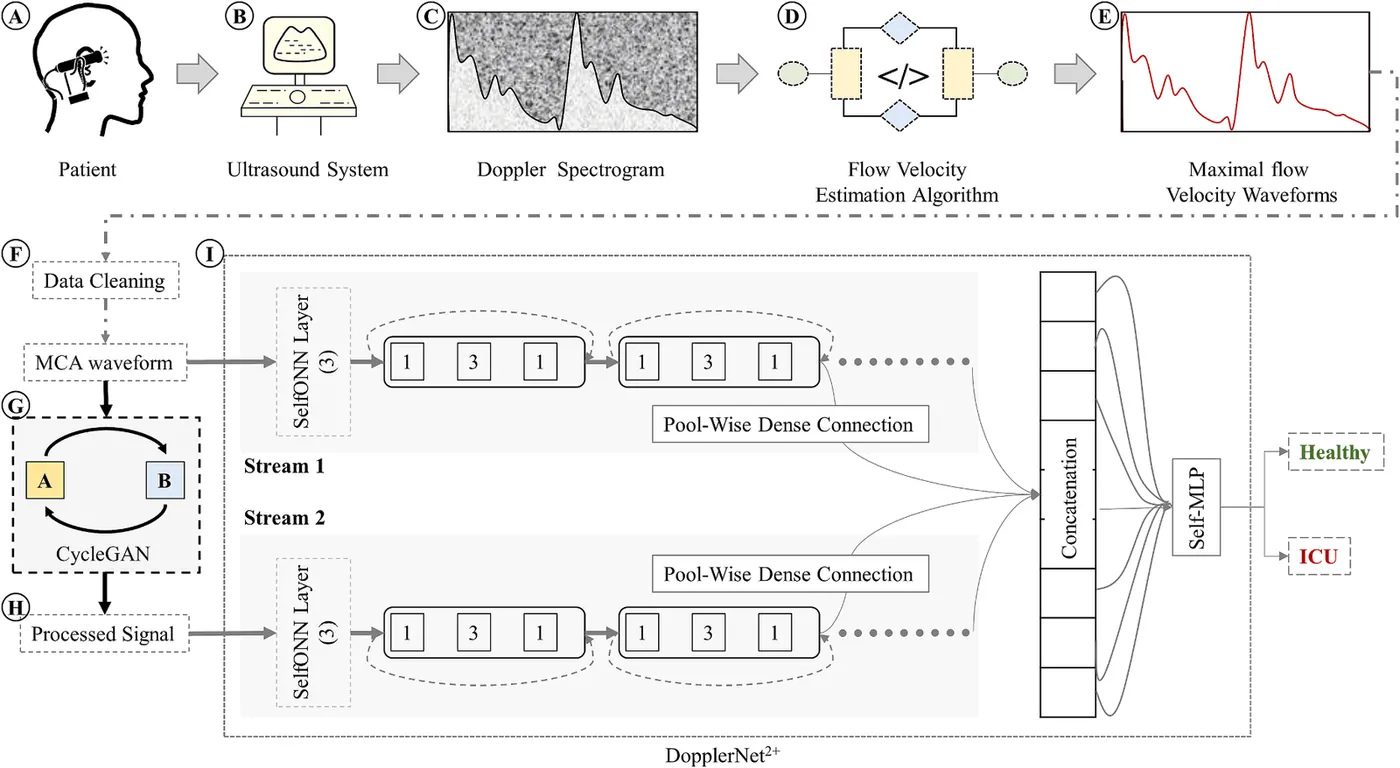
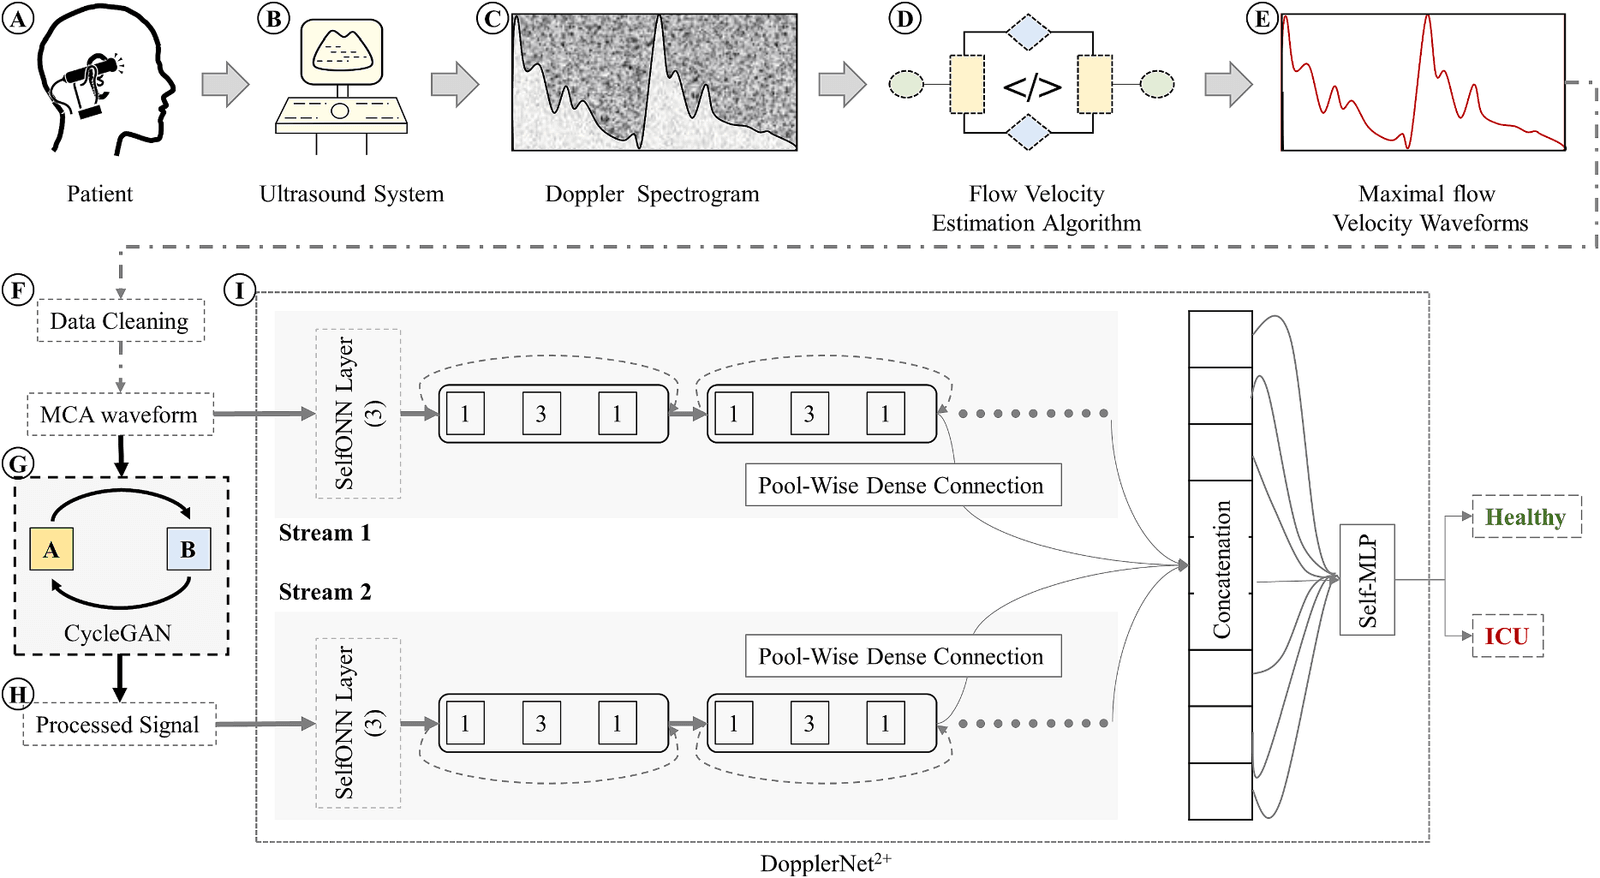
The brain depends on a constant blood supply, and transcranial Doppler can monitor flow velocity in its major arteries without radiation or surgery. Signal quality depends heavily on the operator, so recordings often contain noise and motion artefacts. This project extracted maximum flow-velocity waveforms from the middle cerebral artery, restored low-quality segments with a 1D-CycleGAN, and developed Self-ONN classifiers for healthy and intensive-care recordings.
- Extract flow-velocity waveforms
- Clean and restore segments
- Classify healthy and ICU signals
Restoring low-quality flow-velocity waveforms
Biomedical Signal Processing and Control · 2023
The study used a public dataset recorded over the middle cerebral artery with a portable ultrasound system and a 1.75 MHz transducer. It contains 16 recordings from 6 healthy volunteers and 29 recordings from 12 patients in neurocritical care with hydrocephalus, traumatic brain injury, or intraparenchymal or subarachnoid haemorrhage. The maximum flow-velocity waveform was extracted from each Doppler spectrogram and split into 1,024-sample segments.
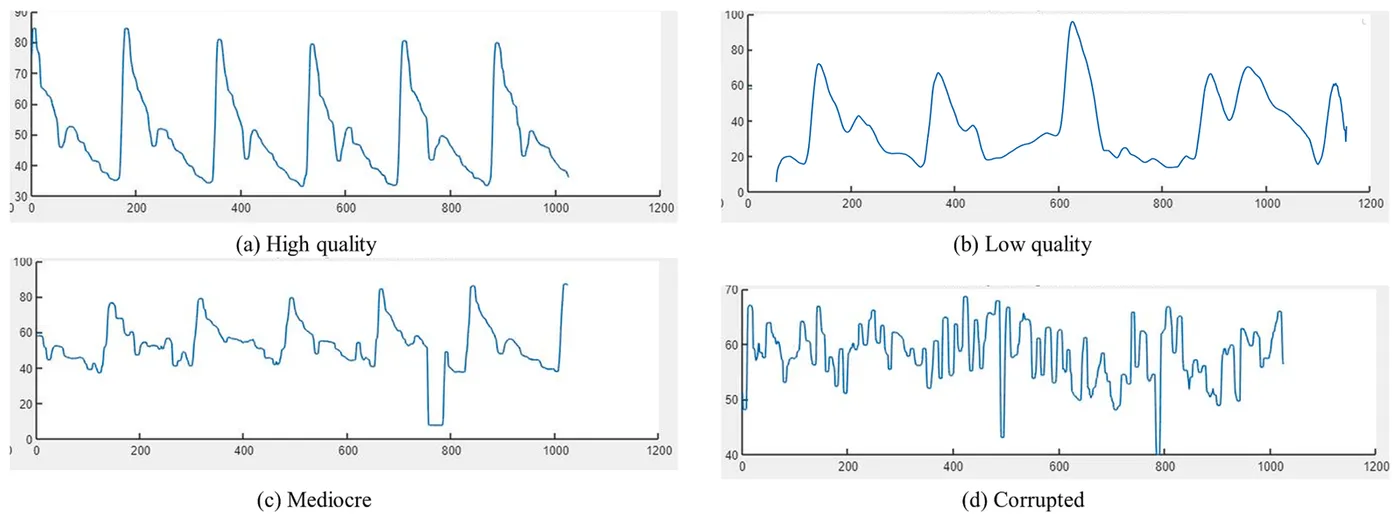
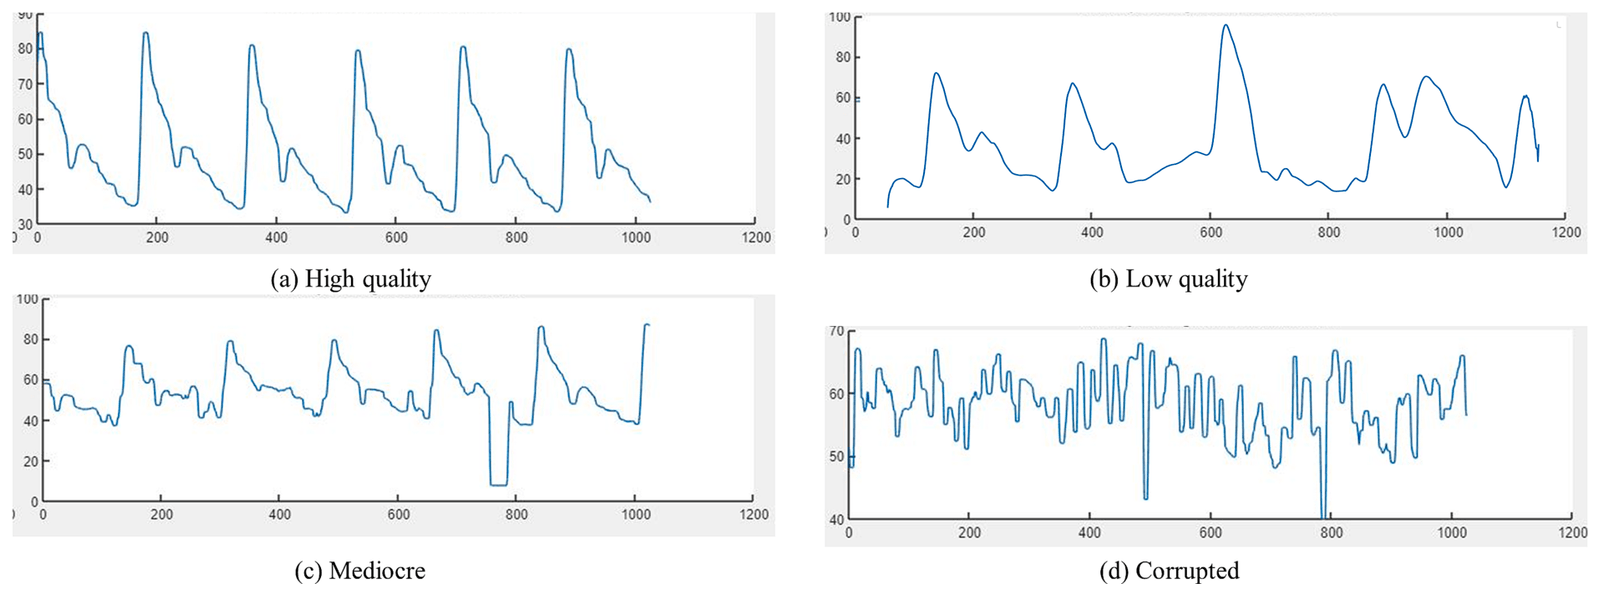
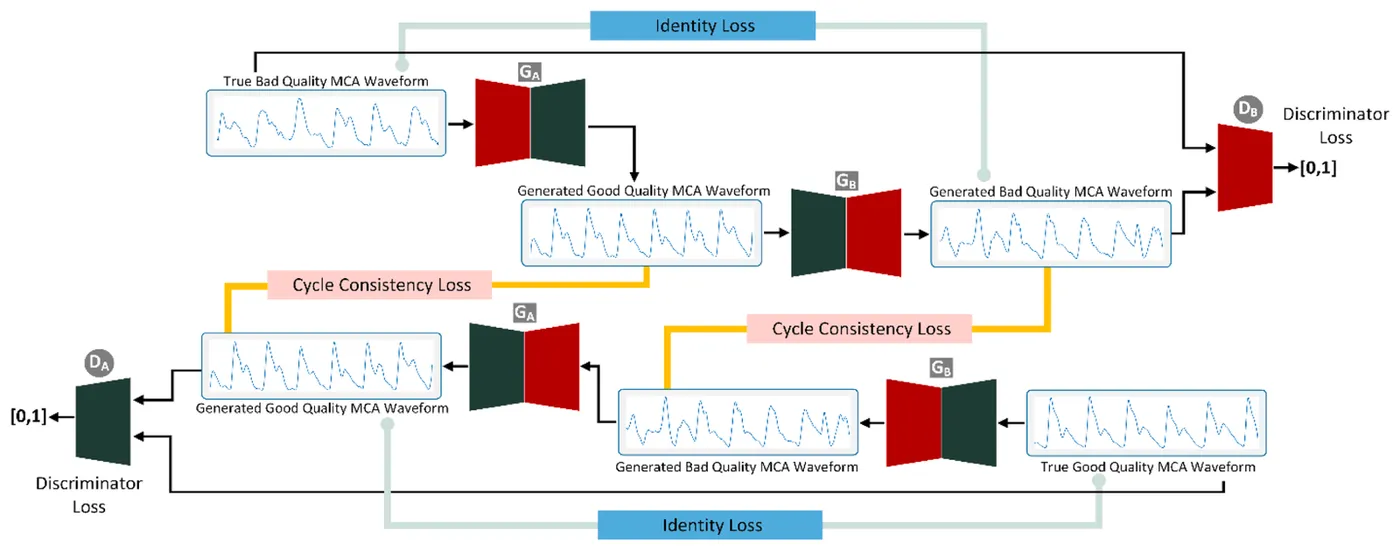
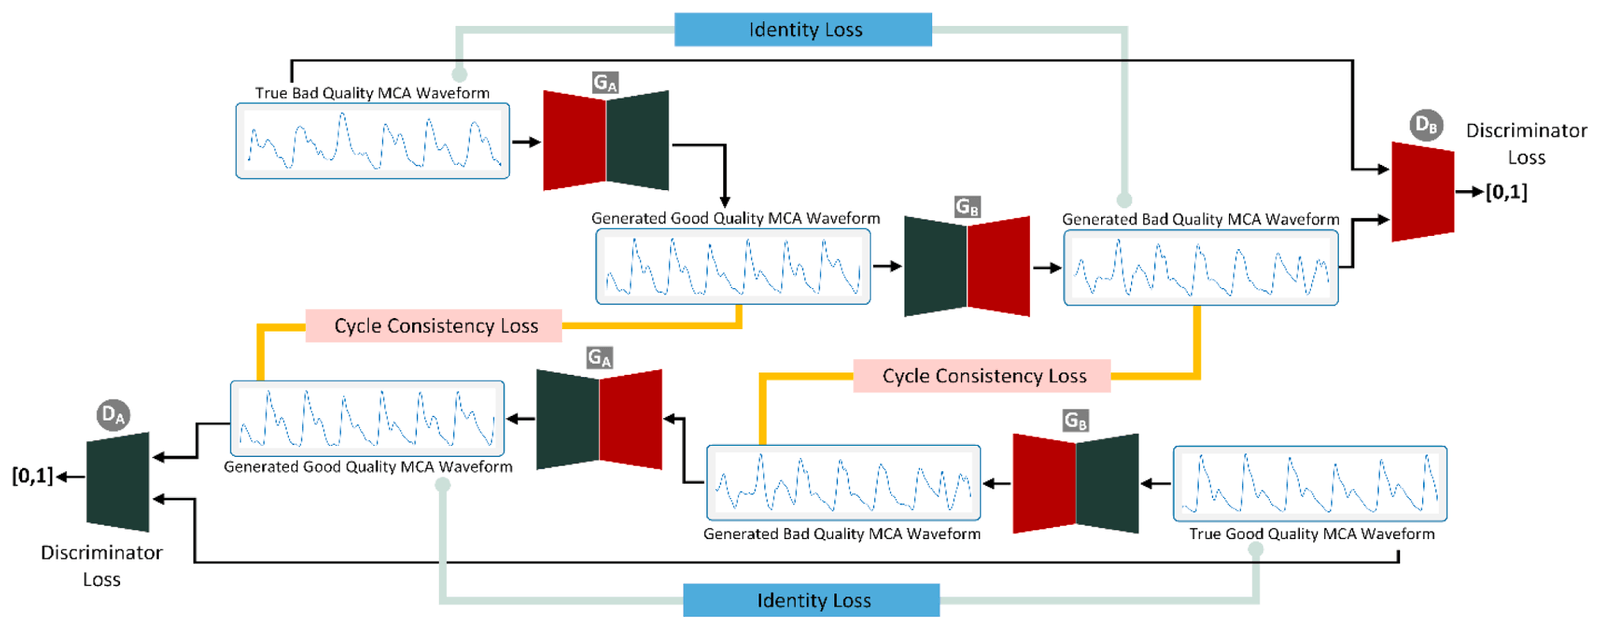
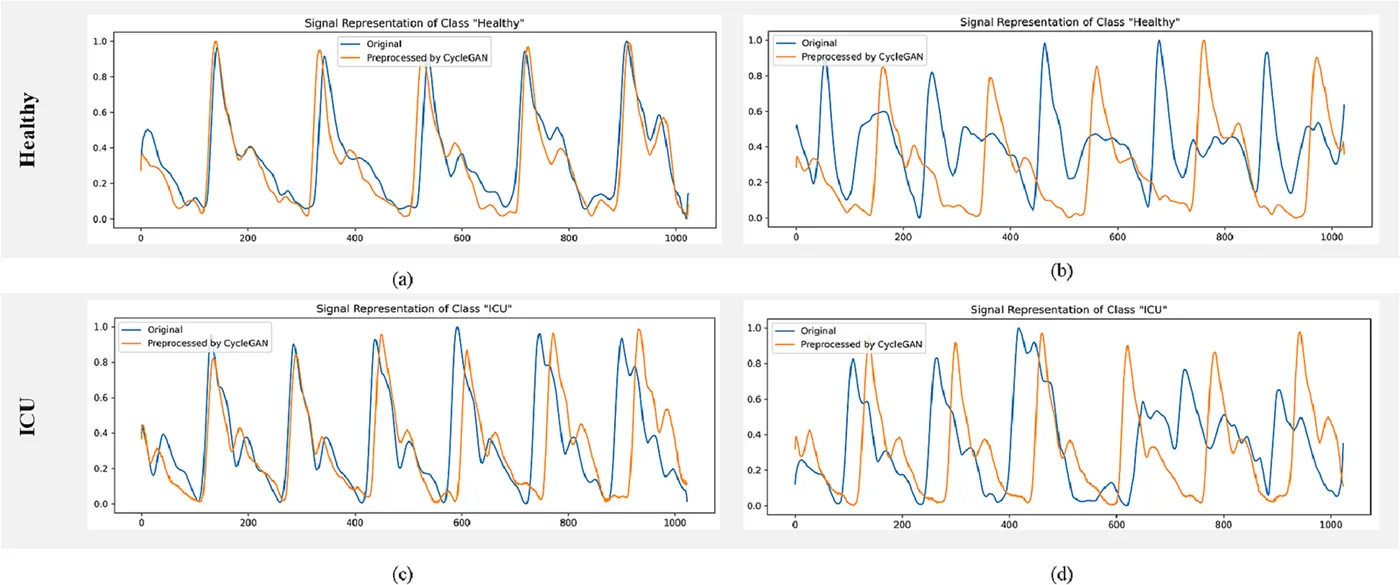
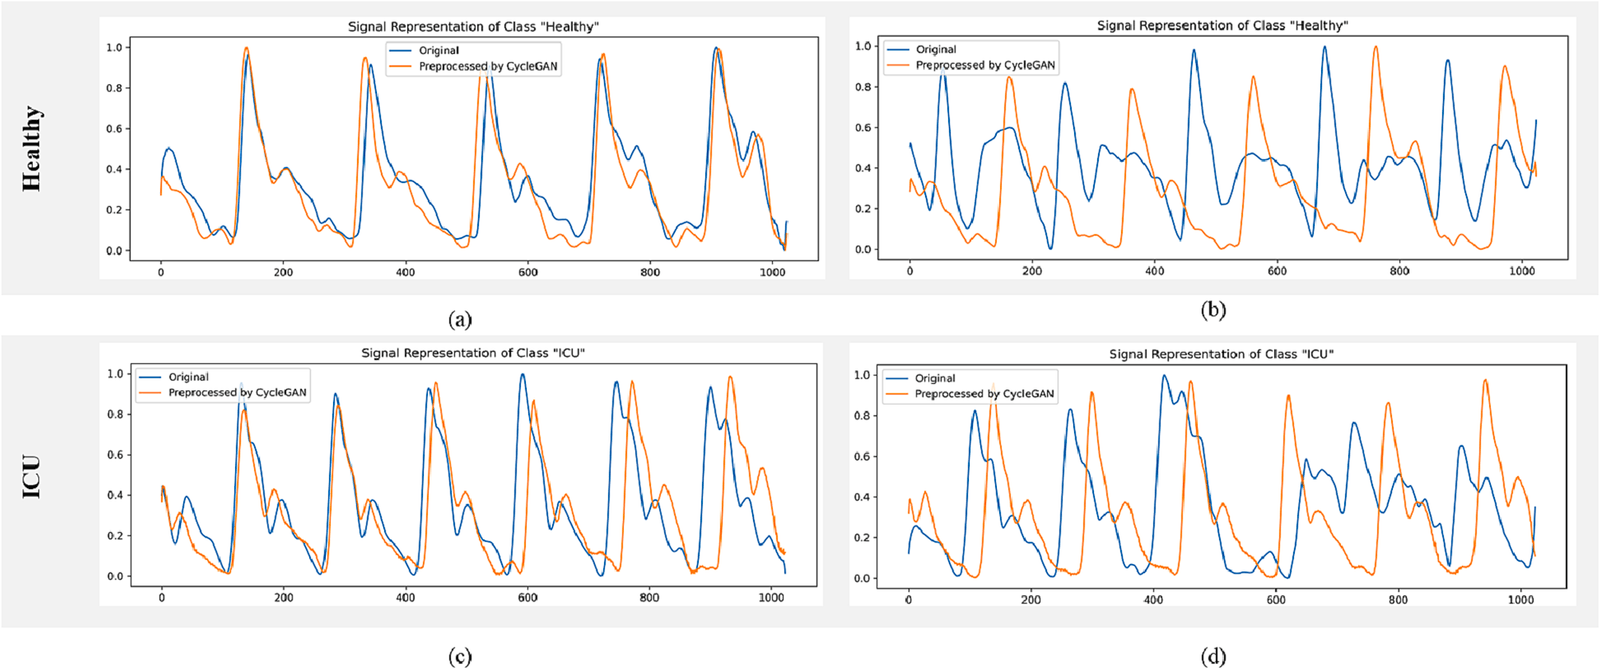
Trained annotators labelled each segment by signal quality. A 1D-CycleGAN with ResNet generators and PatchGAN discriminators then learned to map low-quality segments to high-quality waveforms. It reduced baseline drift and distortion in low-quality signals, while high-quality signals changed very little.
- Participants
- 18
- Segments kept after cleaning
- 3,243
- Low-quality training segments after 75% overlap
- 1,760
| Segments | Use | |
|---|---|---|
| High quality | 2,803 | Kept |
| Low quality | 440 | Kept and restored |
| Mediocre | 2,061 | Removed |
| Corrupted | 164 | Removed |
Two-stream classification with DopplerNet2+
Biomedical Signal Processing and Control · 2023
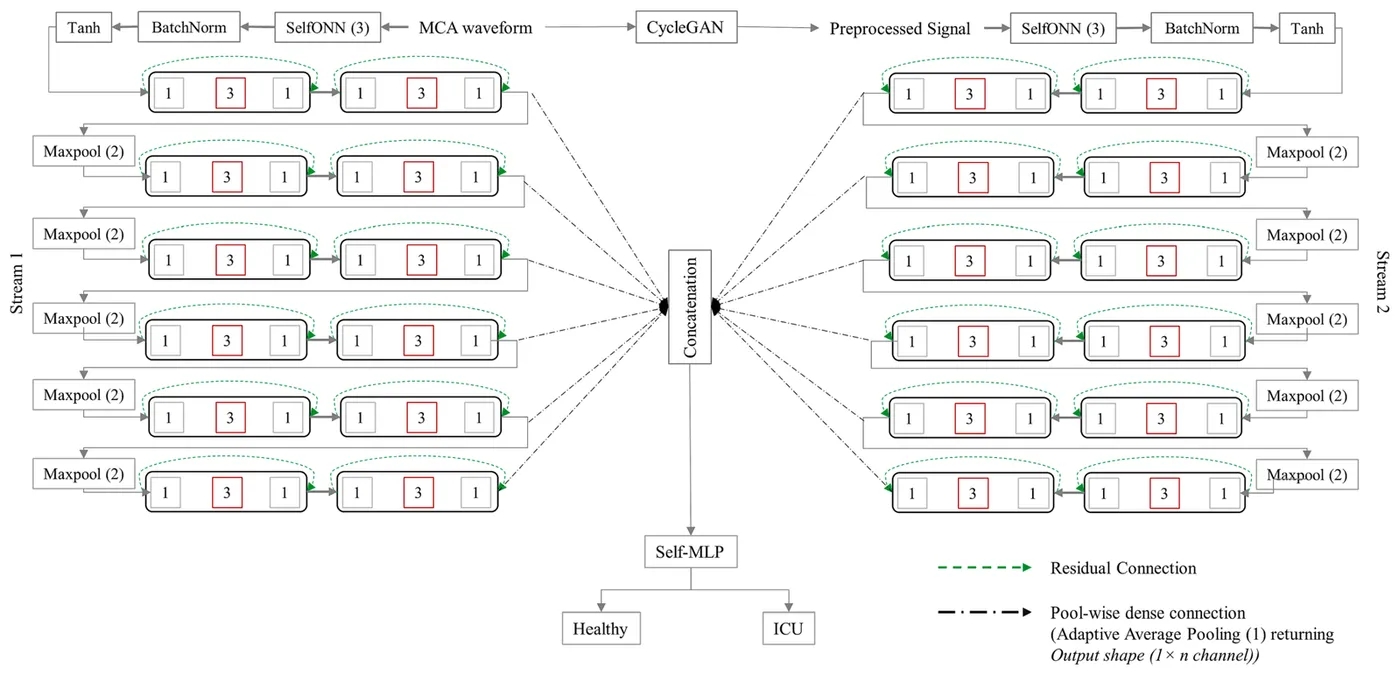
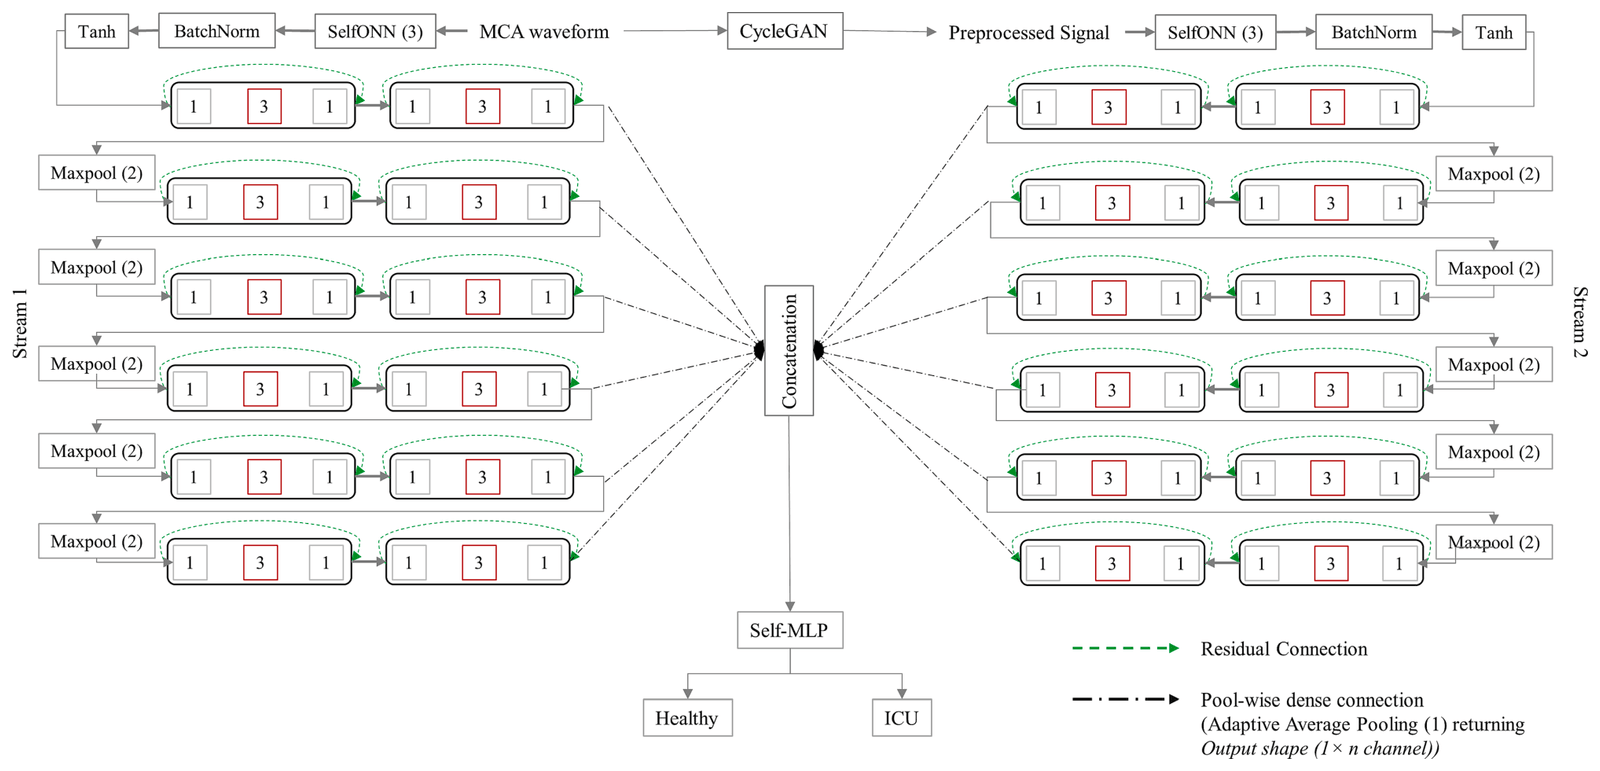
DopplerNet is a one-dimensional Self-ONN classifier built from inverted residual blocks and pool-wise dense connections. DopplerNet2+ extends it with two parallel streams, one for the original waveform and one for the CycleGAN-processed waveform, and combines their features before classification.
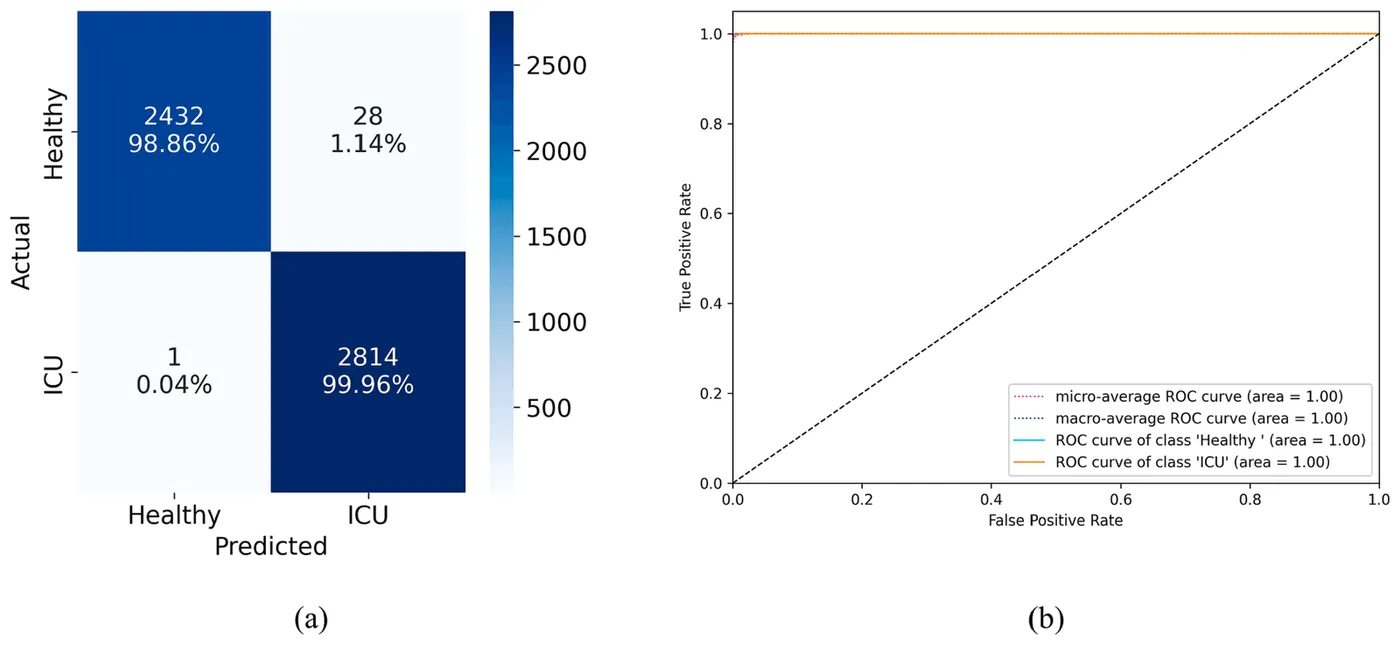
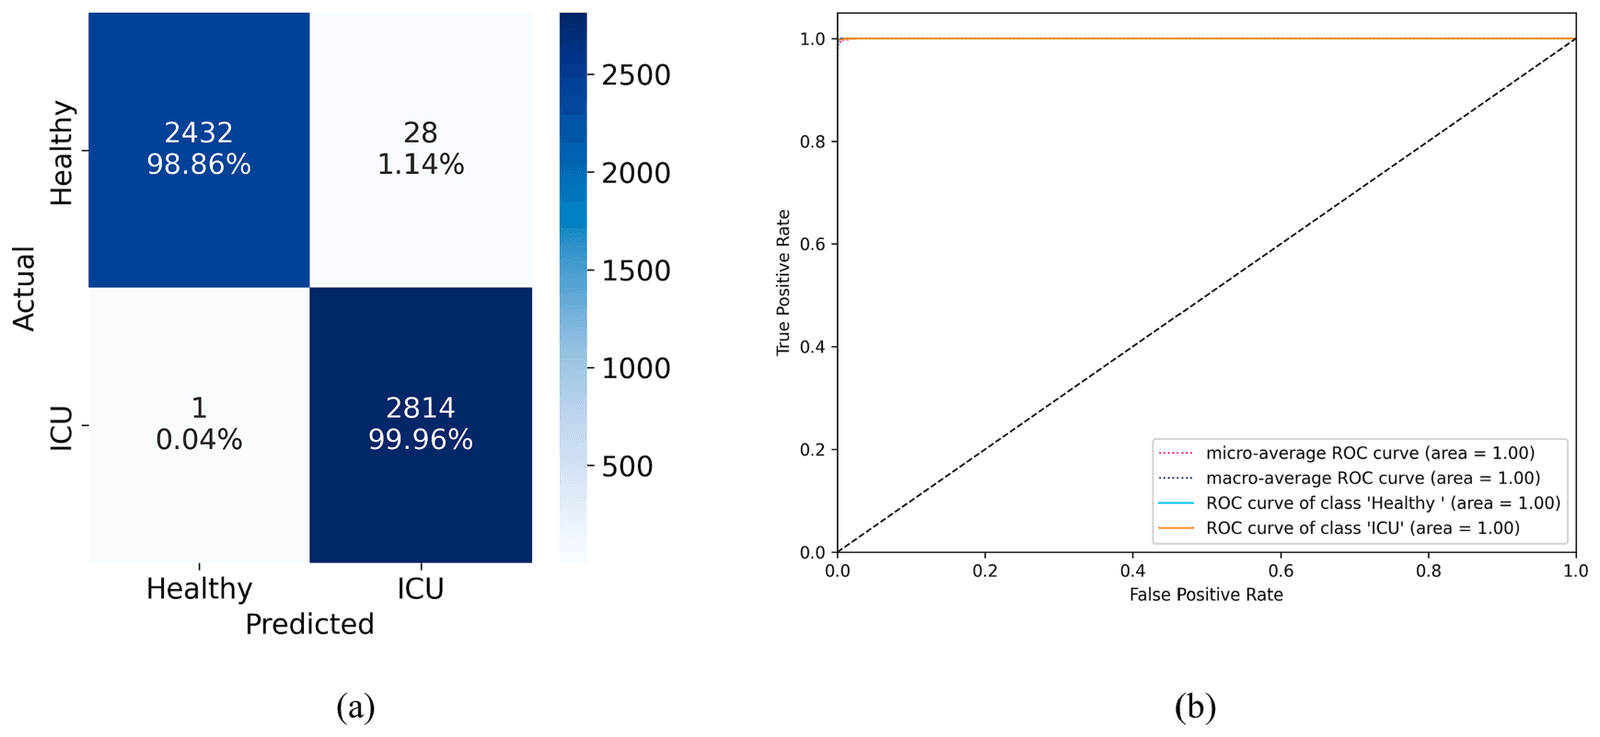
Models were tested with five-fold cross-validation separated by recording session. The two-stream model gave the best result, correctly identifying 98.86% of healthy segments and 99.96% of intensive-care segments.
- Accuracy
- 99.45%
- Specificity
- 99.37%
- Area under the ROC curve
- 1.00
| Parameters | Accuracy | F1 score | Specificity | |
|---|---|---|---|---|
| Original waveform | 199,666 | 97.71% | 97.71% | 97.61% |
| CycleGAN-processed waveform | 587,378 | 95.55% | 95.54% | 95.36% |
| Both as two input channels | 587,666 | 96.64% | 96.64% | 96.43% |
| DopplerNet2+ with two streams | 1,174,754 | 99.45% | 99.45% | 99.37% |
Attention-based classification of clear waveforms
Diagnostics · 2023
The second study classified clear waveform segments directly, without generative restoration. Segments were annotated as clear or corrupted, leaving 1,501 healthy and 1,742 intensive-care segments of 1,024 samples at 217 Hz.
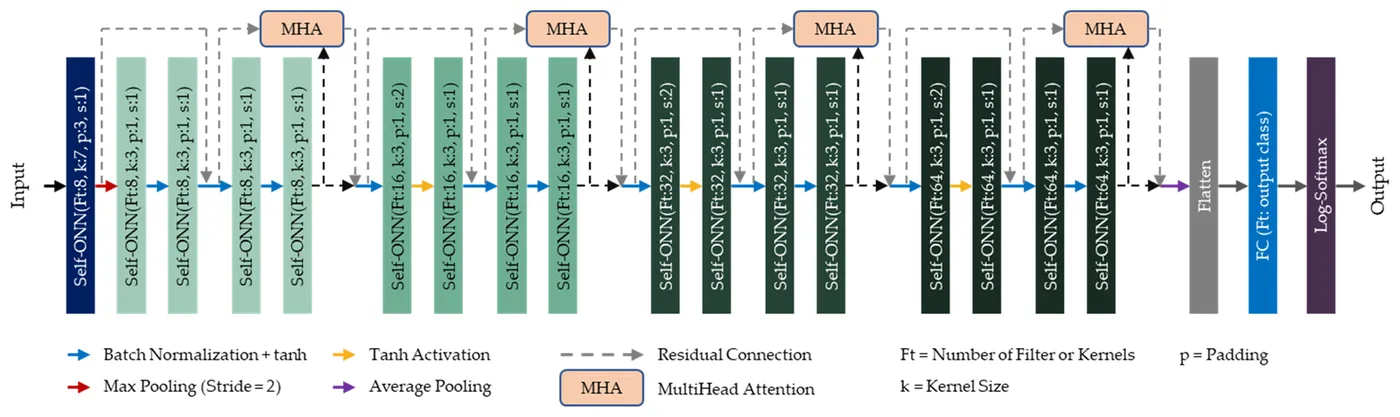
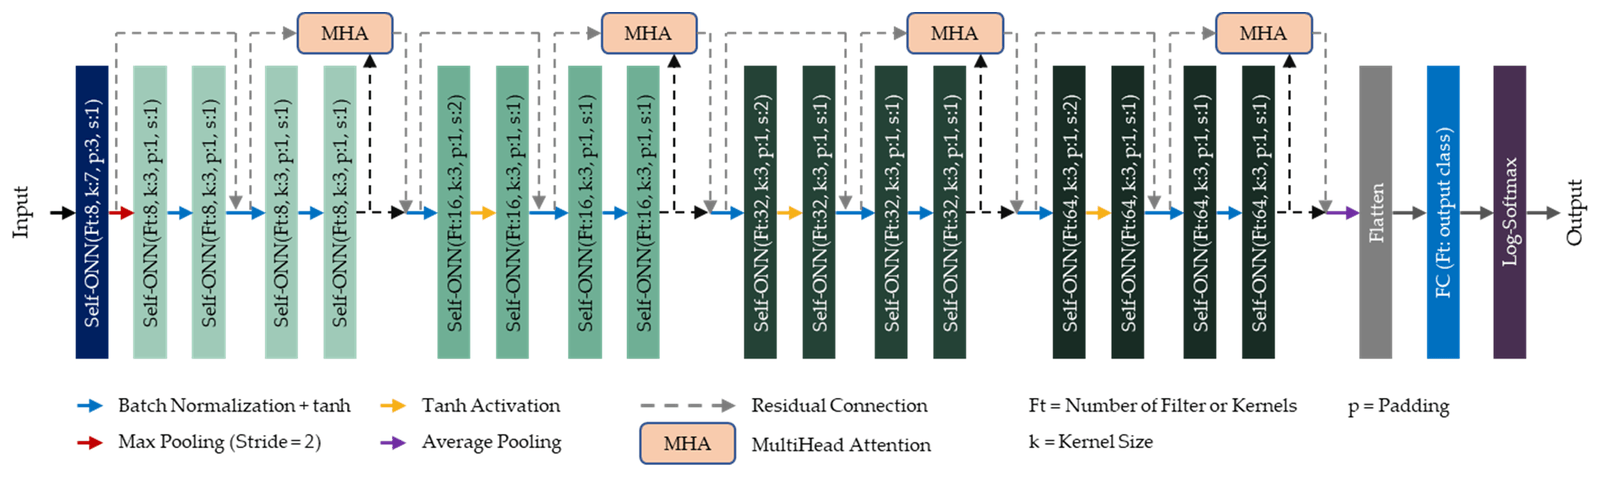
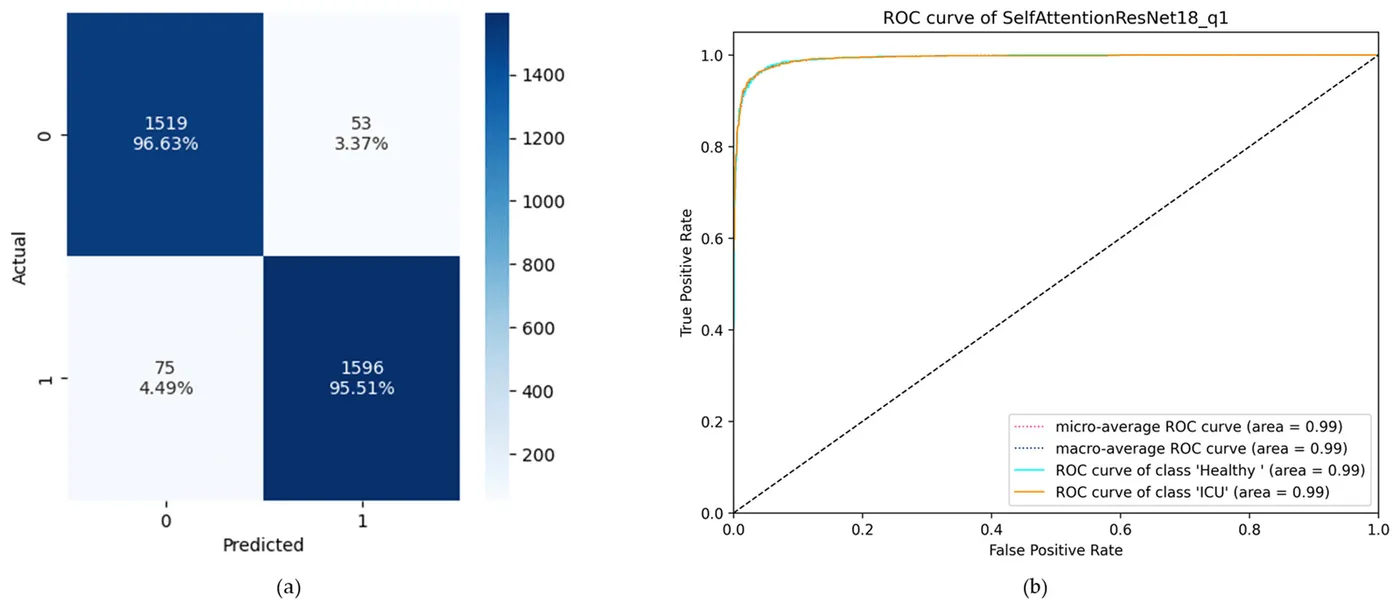
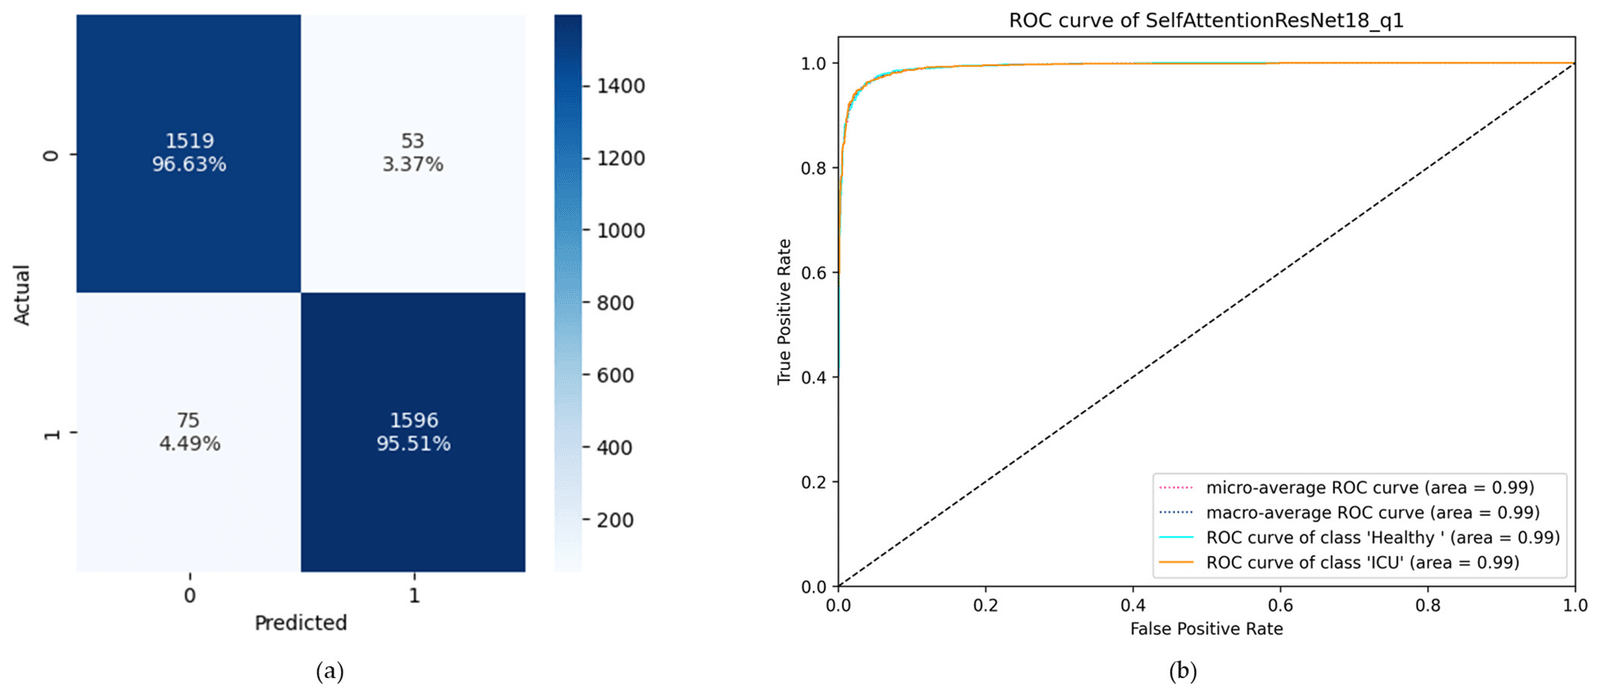
Self-ResNet18 replaces the convolutional layers of ResNet18 with Self-ONN layers, and Self-ResAttentioNet18 adds four multi-head attention layers. Each design was tested at three Self-ONN orders using five-fold validation separated by recording session. Self-ResAttentioNet18 at order 1 performed best, correctly identifying 96.63% of healthy segments and 95.51% of intensive-care segments.
- Accuracy
- 96.05%
- Specificity
- 96.09%
- Area under the ROC curve
- 0.99
| Accuracy | Precision | F1 score | Specificity | |
|---|---|---|---|---|
| Self-ResNet18 Q1 | 93.46% | 93.48% | 93.46% | 93.39% |
| Self-ResNet18 Q3 | 94.91% | 94.92% | 94.91% | 94.88% |
| Self-ResNet18 Q5 | 93.31% | 93.32% | 93.30% | 93.26% |
| Self-ResAttentioNet18 Q1 | 96.05% | 96.06% | 96.06% | 96.09% |
| Self-ResAttentioNet18 Q3 | 95.31% | 95.34% | 95.31% | 95.37% |
| Self-ResAttentioNet18 Q5 | 92.97% | 93.01% | 92.97% | 93.03% |
My contribution
Across the two studies, I worked on waveform extraction and CycleGAN restoration, classifier development, data curation and preprocessing, MATLAB software, analysis, visualisation, and manuscript writing.
Study scope
Both studies used one public dataset from 6 healthy volunteers and 12 patients, with testing separated by recording session. The patient class combined several neurocritical conditions, and signal-quality labels were assigned manually. Larger and more diverse cohorts, condition-specific labels and automated quality assessment are needed before clinical use.
Publications
- Deep learning-based middle cerebral artery blood flow abnormality detection using flow velocity waveform derived from transcranial Doppler ultrasoundBiomedical Signal Processing and Control · 2023
- A Deep Learning Framework for the Detection of Abnormality in Cerebral Blood Flow Velocity Using Transcranial Doppler UltrasoundDiagnostics · 2023