Physiological signal processing · 2022–2023
Presymptomatic COVID-19 detection from smartwatch heart rate
Personalised anomaly detection on smartwatch resting heart rate that flags COVID-19 infection, often before symptoms begin.
Qatar University · Qatar National Research Fund UREP28-144-3-046


Approach
Can changes in resting heart rate recorded by consumer smartwatches reveal COVID-19 infection before symptoms appear?
COVID-19 spreads before symptoms appear, and RT-PCR testing rarely happens that early. Smartwatches and fitness trackers already record heart rate and steps around the clock. This project treated infection as an anomaly in each person’s resting heart rate: a model learns that person’s normal pattern from the weeks before illness and flags periods it cannot reconstruct. Both studies used public Fitbit data from a Stanford University study of COVID-19.
- Derive resting heart rate
- Learn each person’s normal pattern
- Flag anomalies around symptom onset
A personalised LSTM variational autoencoder
Computers in Biology and Medicine · 2022
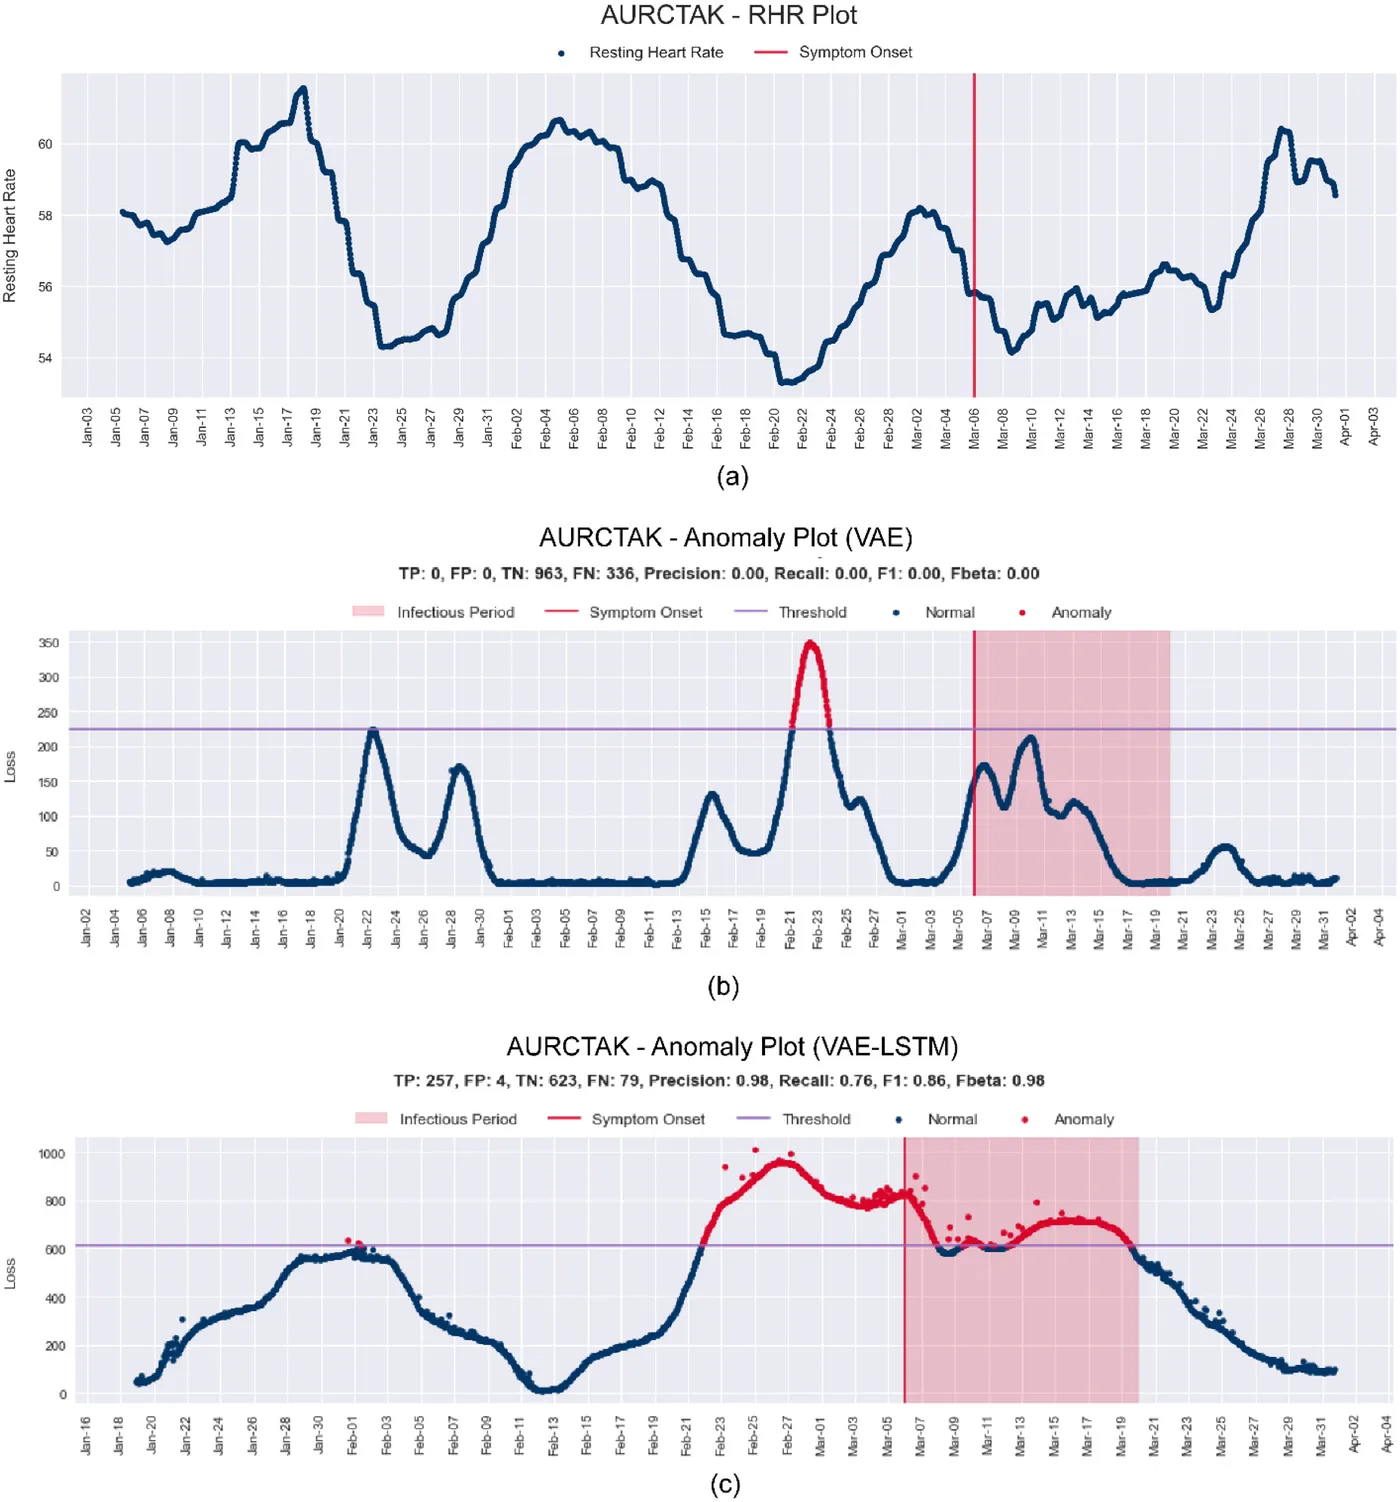
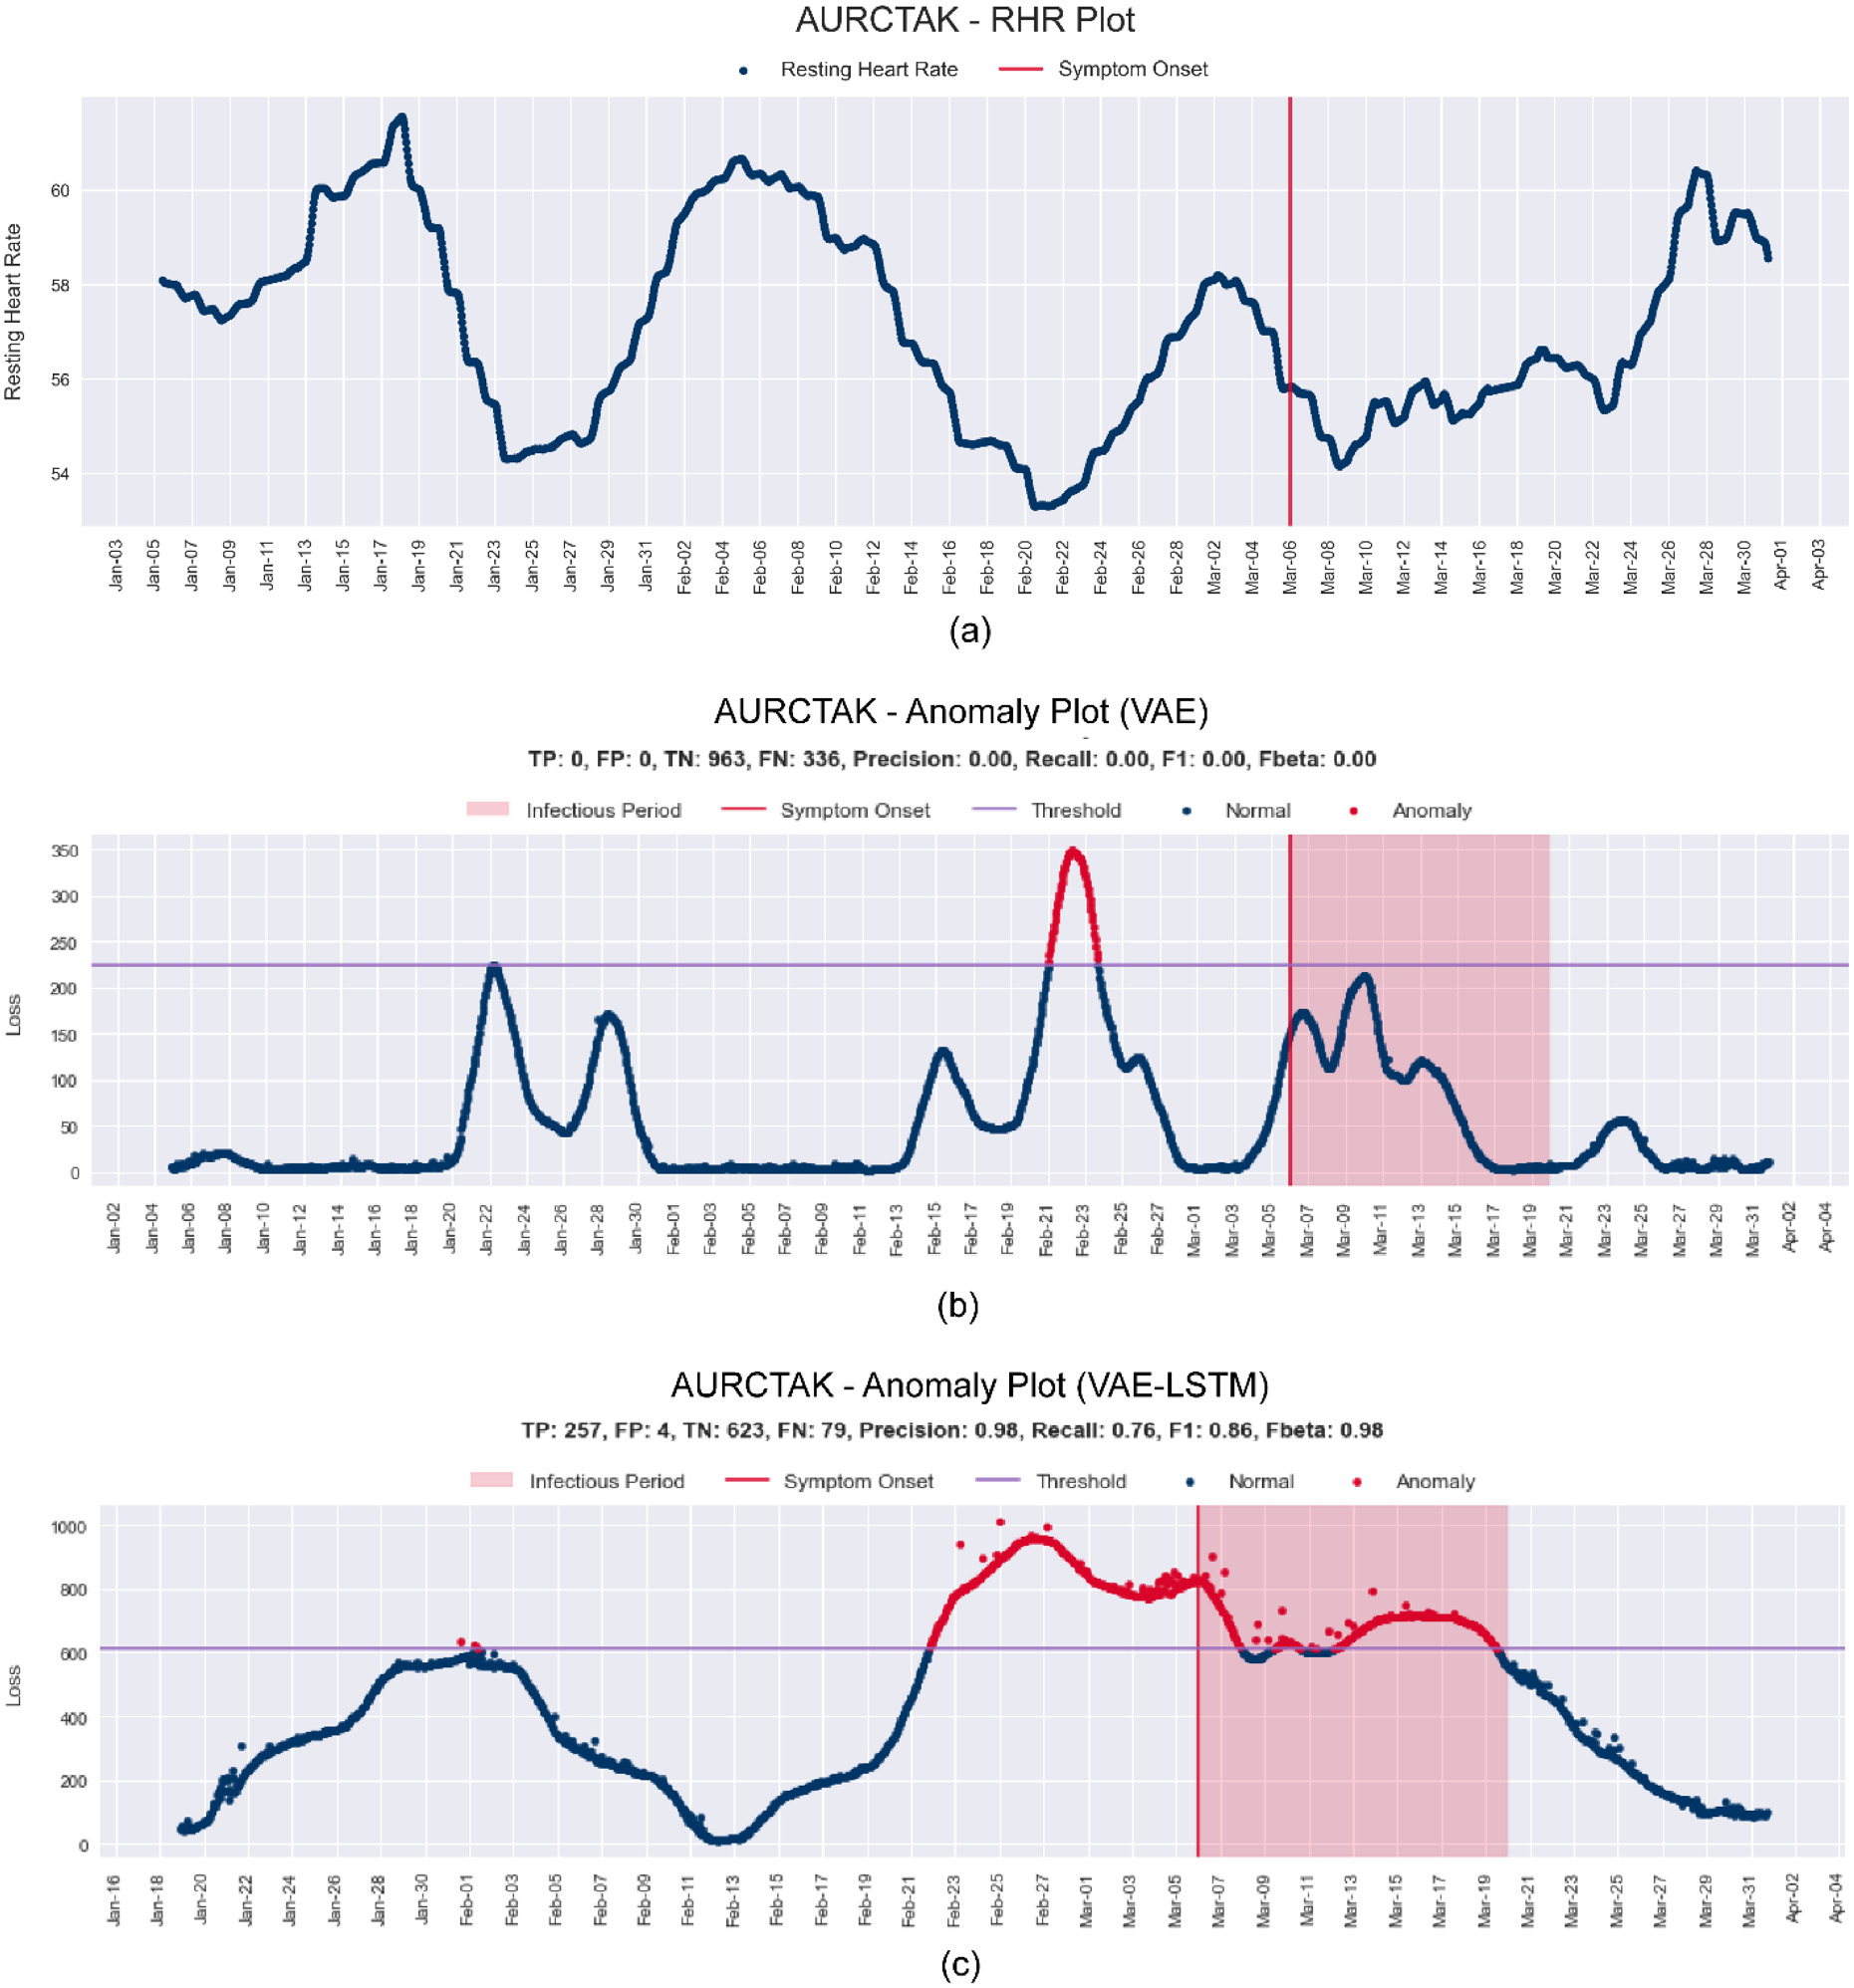
Resting heart rate was derived from minute-level heart rate and step counts, keeping only minutes that followed 12 minutes without steps. It was then smoothed over 6 hours 40 minutes and resampled hourly to remove short-lived rises from daily activity.
Each of 25 people with COVID-19 had a separate model, trained only on their own baseline more than 20 days before symptom onset. Seven time-series augmentations enlarged these small training sets. An LSTM variational autoencoder reconstructed 8-hour windows, and windows it could not reconstruct well were flagged as anomalous.
Two thresholds traded precision against early warning. Using the largest training loss gave a precision of 0.946. A lower threshold, three standard deviations above the mean training loss, flagged 20 of the 25 people before their symptoms began and missed none.
- People with COVID-19
- 25
- Flagged before symptom onset (sensitive threshold)
- 80%
- Precision (strict threshold)
- 0.946
| Days from symptom onset | Use in the study | |
|---|---|---|
| Baseline | Before day −20 | Training data for each person’s model |
| Non-infectious | Day −20 to −10 | Test data treated as normal |
| Infectious | Day −7 to 21 | Test data treated as anomalous |
| Recovery | After day 21 | Test data; heart rate can stay raised |
Convolutional autoencoder with LSTM embeddings
Engineering Applications of Artificial Intelligence · 2023
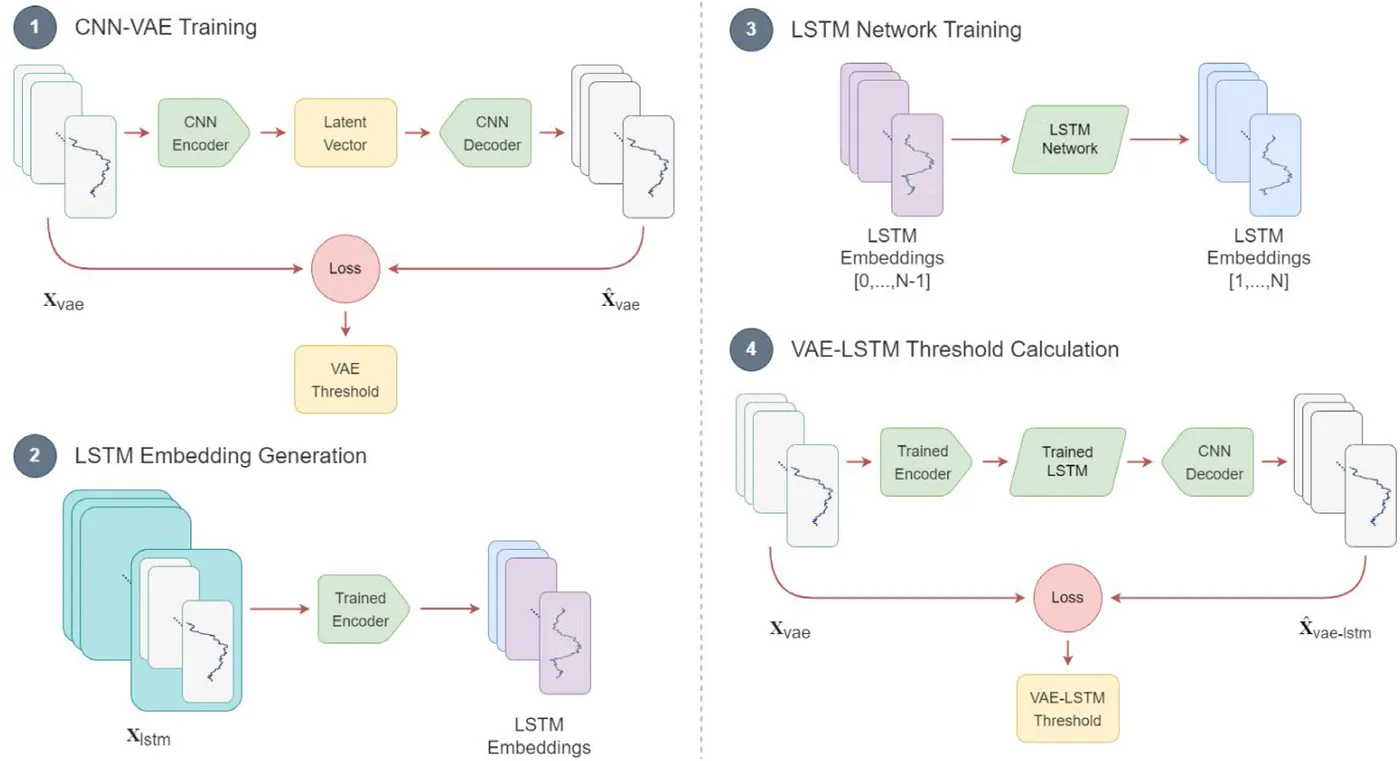
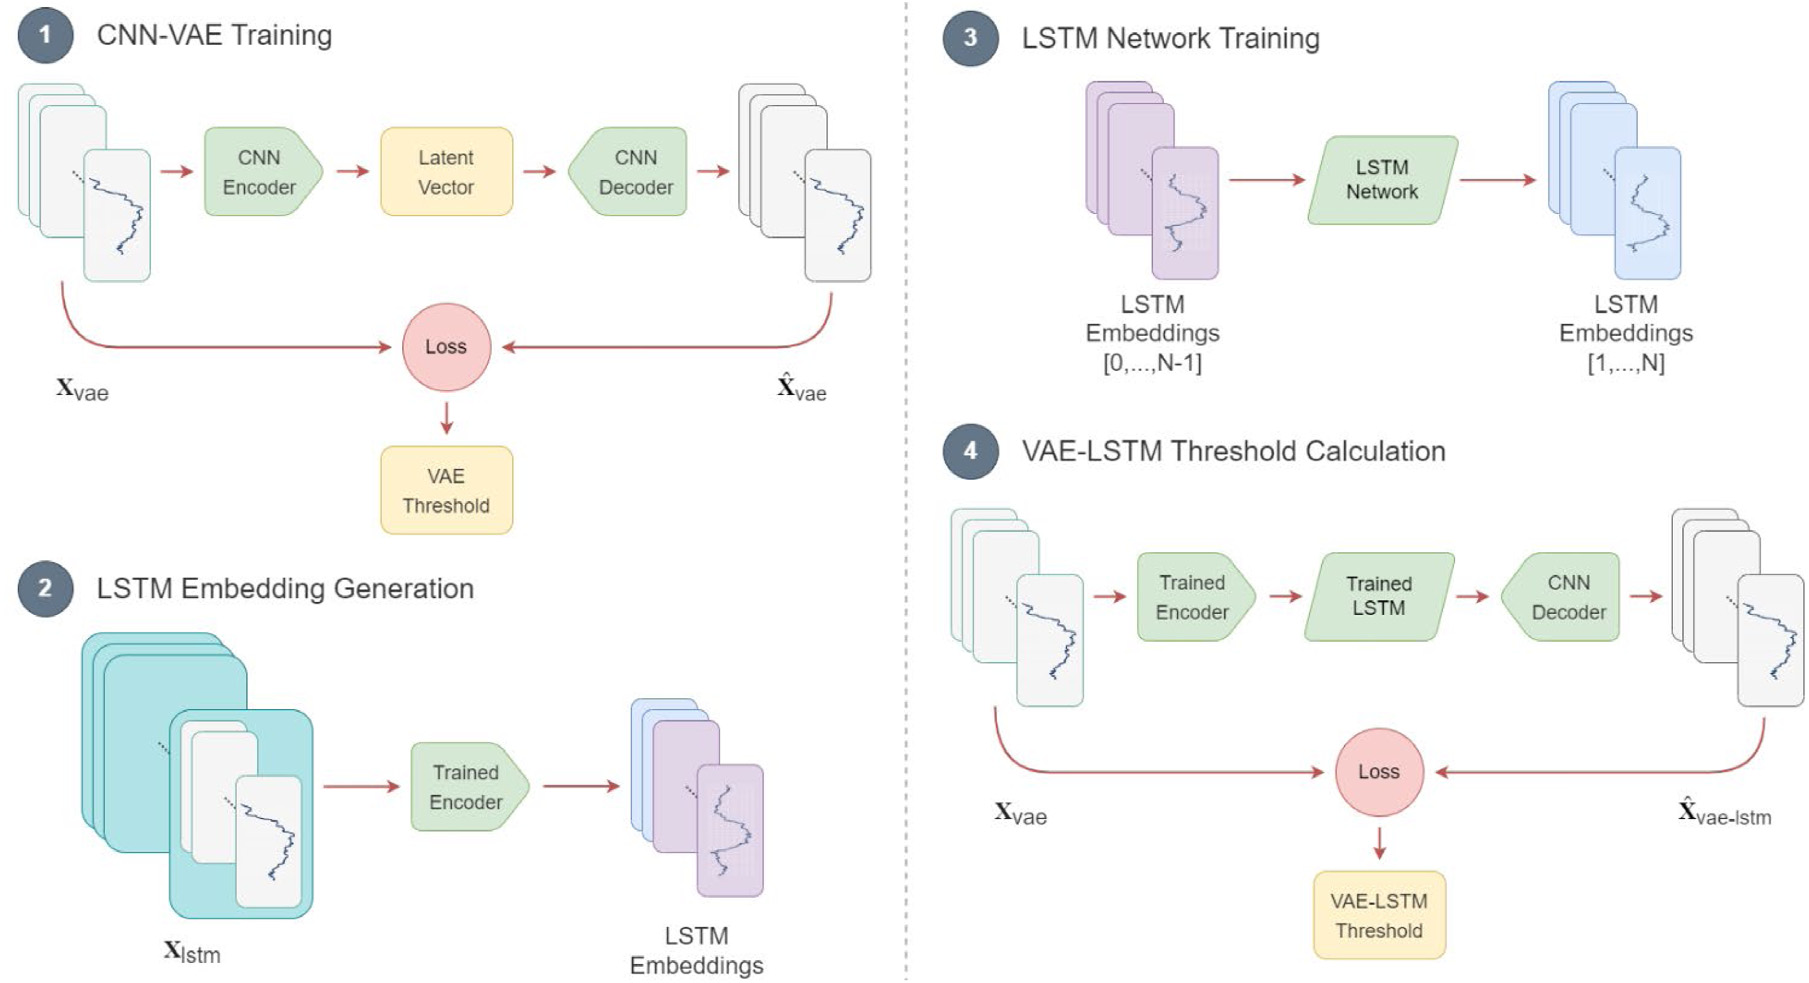
PCovNet+ extended the evaluation to 68 people with COVID-19 by adding the second phase of the Stanford University study. A convolutional variational autoencoder encoded each window, and an LSTM network learned how these encodings change over time, so the decoder rebuilt each window from embeddings that carried its recent history.
Many people had only a short baseline before infection, so both networks were first pre-trained on healthy participants and then fine-tuned on each person’s own baseline. The framework was also set out so that a model could keep updating as new smartwatch data arrive.
Across the 68 people, PCovNet+ reached a precision of 0.993, a recall of 0.534 and an F1 score of 0.693, and flagged infection in 74% of them: 47% before symptom onset and 27% after. Adding the LSTM embeddings raised recall and F1 in both phases of the study.
- People with COVID-19
- 68
- Precision
- 0.993
- Flagged before symptom onset
- 47%
| People | Precision | Recall | F1 score | Before onset | After onset | Missed | |
|---|---|---|---|---|---|---|---|
| PCovNet, strict threshold | 25 | 0.946 | 0.234 | 0.375 | 44% | 44% | 12% |
| PCovNet, sensitive threshold | 25 | 0.904 | 0.274 | 0.421 | 80% | 20% | 0% |
| PCovNet+ | 68 | 0.993 | 0.534 | 0.693 | 47% | 27% | 26% |
My contribution
For PCovNet, I contributed to the wearable-data analysis, model evaluation, interpretation and manuscript review. For PCovNet+, I worked on the software and on the analysis of the method and experiments, and reviewed and edited the manuscript.
Study scope
Both studies used one public cohort of Fitbit users with self-reported symptom onset, and the infectious period was set from the literature rather than measured for each person. Resting heart rate also changes with other illnesses, stress and daily routine, so a flag points to possible infection rather than a diagnosis. Prospective testing would be needed before real-world use.
Publications
- PCovNet: A presymptomatic COVID-19 detection framework using deep learning model using wearables dataComputers in Biology and Medicine · 2022
- PCovNet+: A CNN-VAE anomaly detection framework with LSTM embeddings for smartwatch-based COVID-19 detectionEngineering Applications of Artificial Intelligence · 2023
Code
- PCovNetResearch software and repository details