Physiological signal processing · 2022–2023
Cuffless blood pressure and arterial waveform estimation from PPG and ECG
Deep learning methods that estimate systolic and diastolic pressure and reconstruct continuous arterial blood pressure waveforms from PPG and ECG signals.
Qatar National Research Fund NPRP12S-0227-190164 · Qatar University IRCC-2021-001 and QUST-2-CENG-2022-711
Approach
Can non-invasive PPG and ECG signals provide accurate blood pressure values and a continuous arterial pressure waveform?
Cuffs provide intermittent readings, while a continuous arterial pressure waveform usually requires an arterial catheter. This project used PPG and ECG to estimate blood pressure without either limitation. The work first predicted systolic and diastolic values, then reconstructed the waveform from PPG alone, and finally combined pressure prediction with waveform reconstruction.
- Prepare PPG and ECG
- Predict pressure values
- Reconstruct the waveform
Predicting systolic and diastolic pressure with a shallow U-Net
Sensors · 2022
The study used the UCI cuffless blood pressure dataset, with 12,000 records from 942 intensive-care patients containing simultaneous PPG, ECG and arterial pressure. Signals were split into 8.192-second segments and distorted segments were removed. Three parts of the dataset formed the training data, and the fourth part provided 53,043 independent test segments.
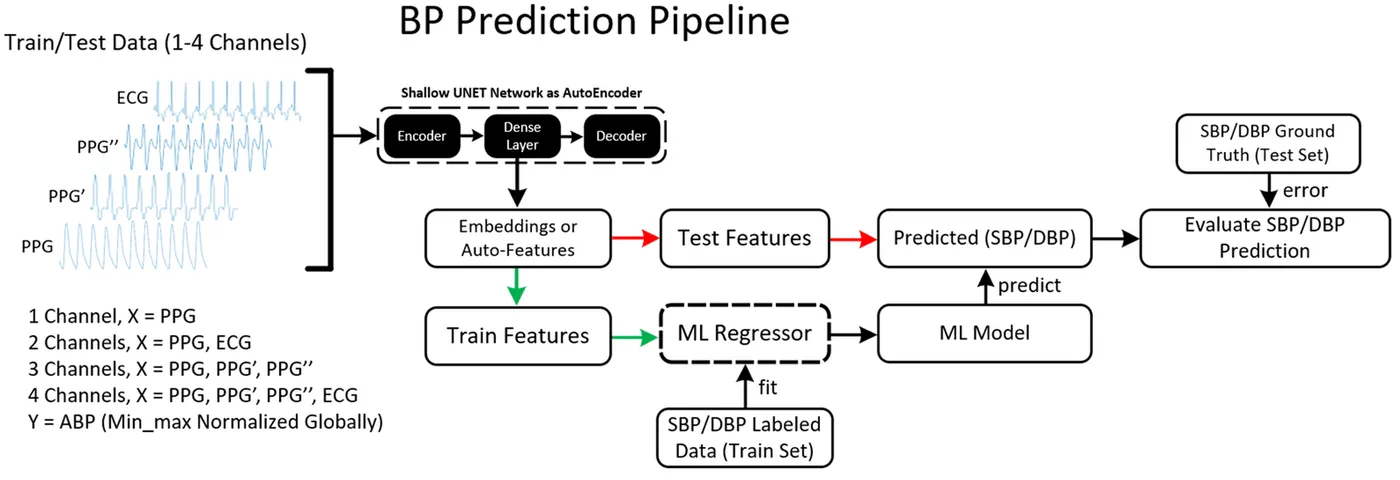
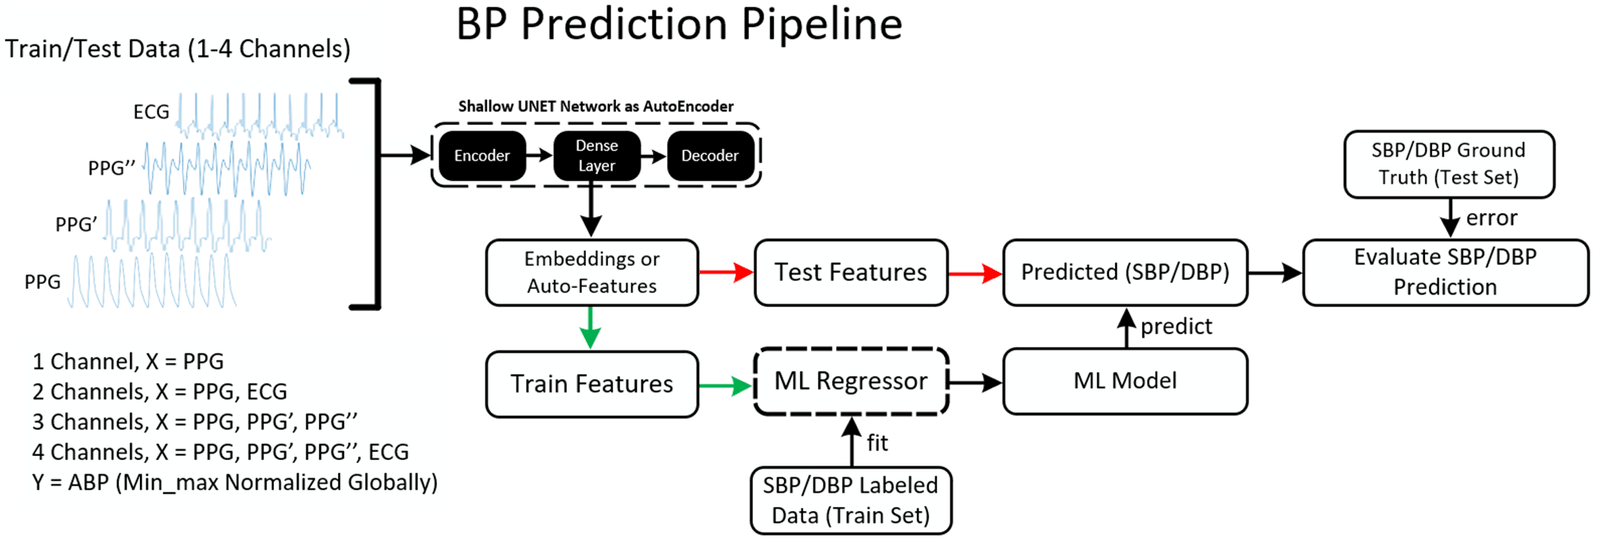
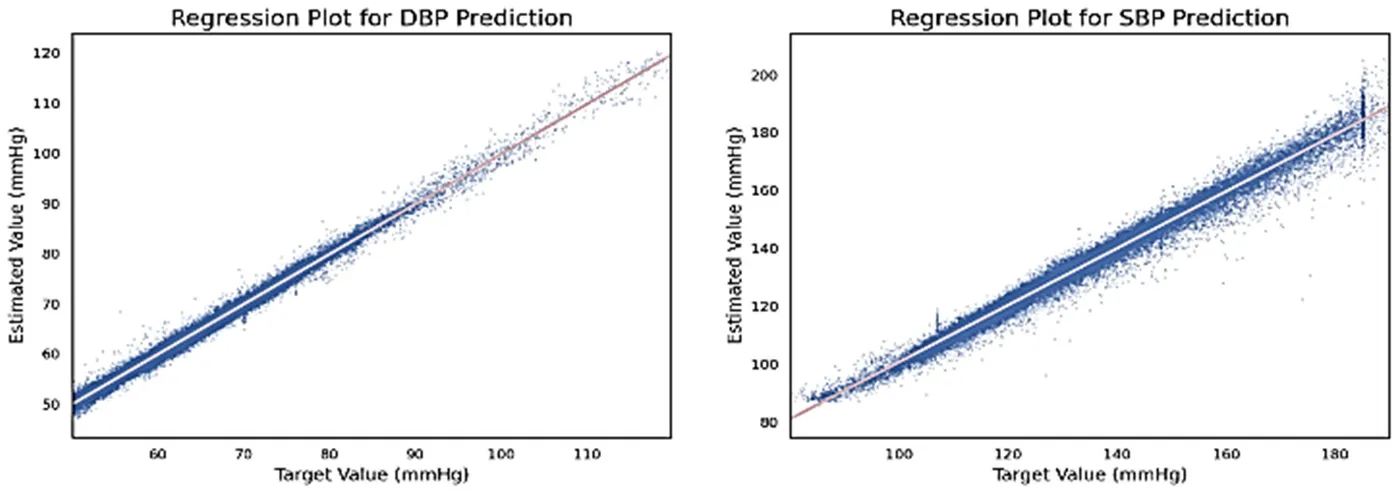
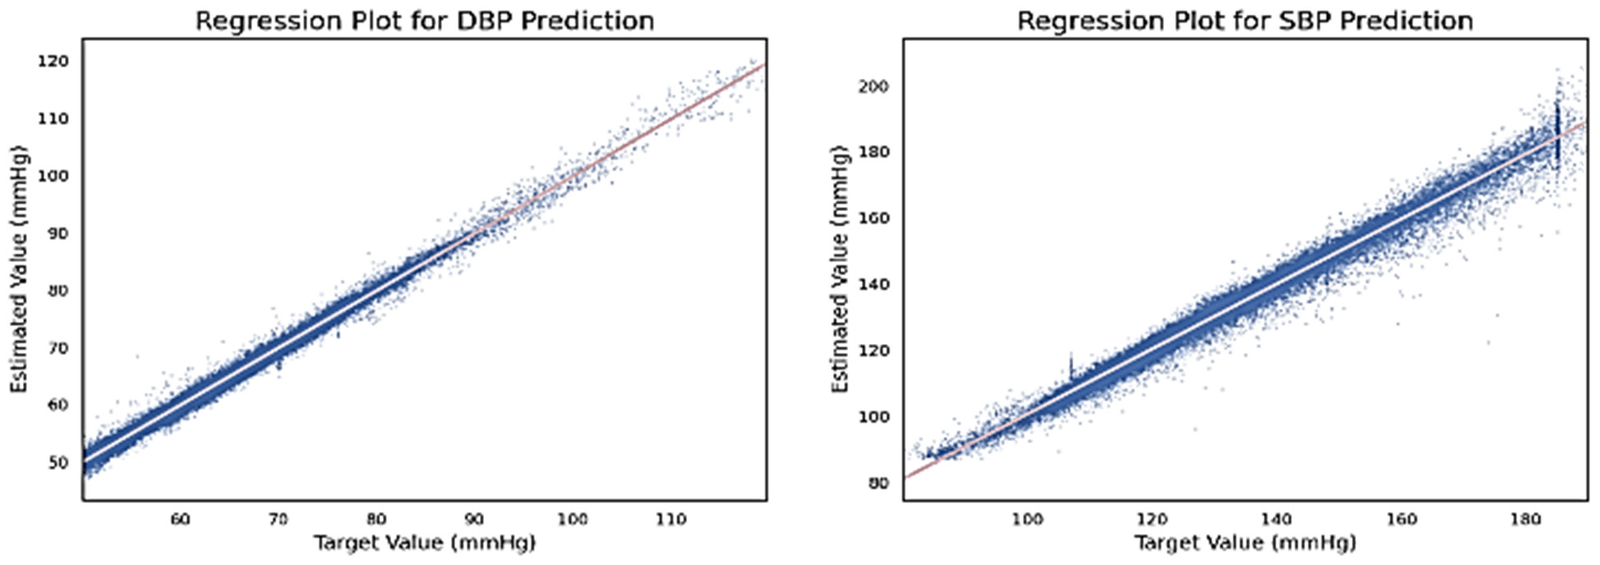
A U-Net learned to map PPG, its two derivatives and ECG to the arterial pressure waveform. Its bottleneck supplied 1,024 learned features to a multilayer perceptron, which predicted systolic and diastolic pressure. Performance fell as the encoder became deeper, so the final model used one level and about 0.55 million parameters.
Using all four inputs gave the lowest error. PPG with its two derivatives performed close to PPG with ECG, suggesting a simpler setup without ECG electrodes. The model met the British Hypertension Society (BHS) Grade A and AAMI criteria on the test set, and it also kept low errors on an external dataset of 40 people.
- Systolic mean absolute error
- 2.333 mmHg
- Diastolic mean absolute error
- 0.713 mmHg
- BHS grade for both pressures
- Grade A
| Systolic | Diastolic | |
|---|---|---|
| PPG only | 4.971 | 1.361 |
| PPG and ECG | 2.513 | 0.825 |
| PPG and two derivatives | 2.739 | 0.960 |
| All four inputs | 2.333 | 0.713 |
| External dataset of 40 people | 2.728 | 1.166 |
Translating PPG alone into arterial pressure waveforms
Bioengineering · 2022
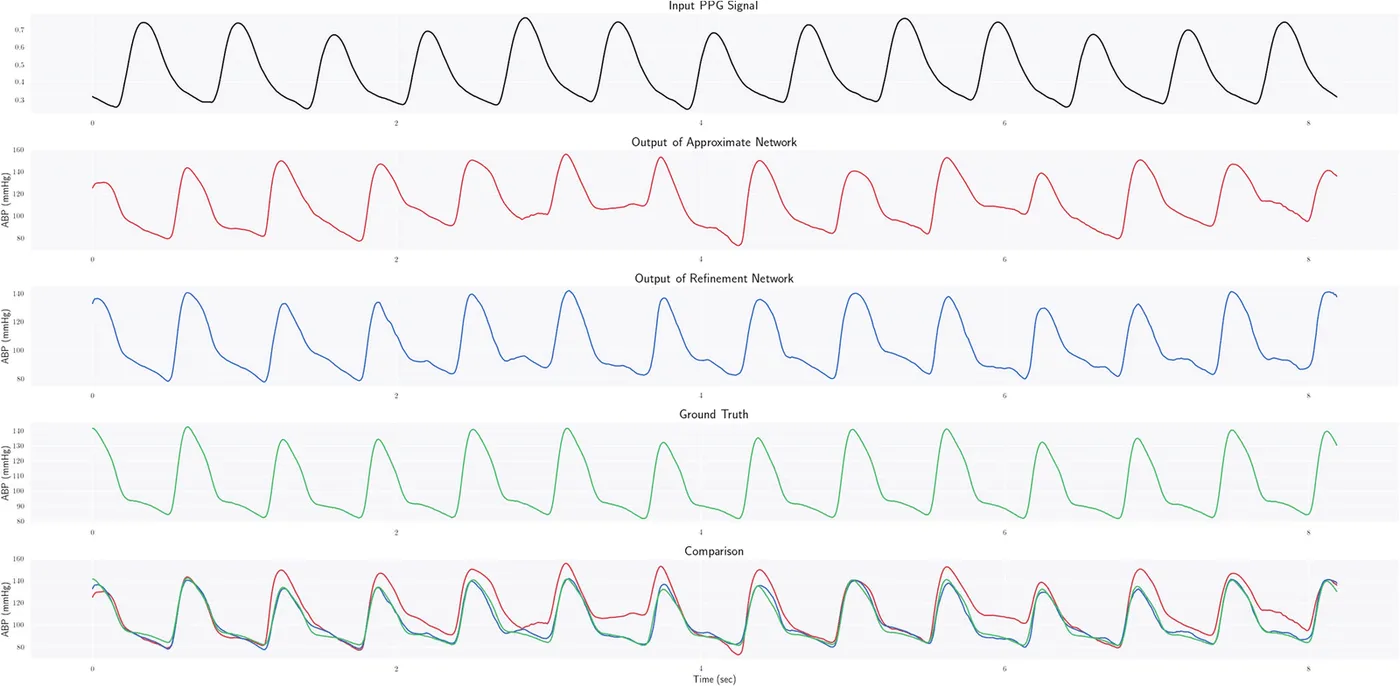
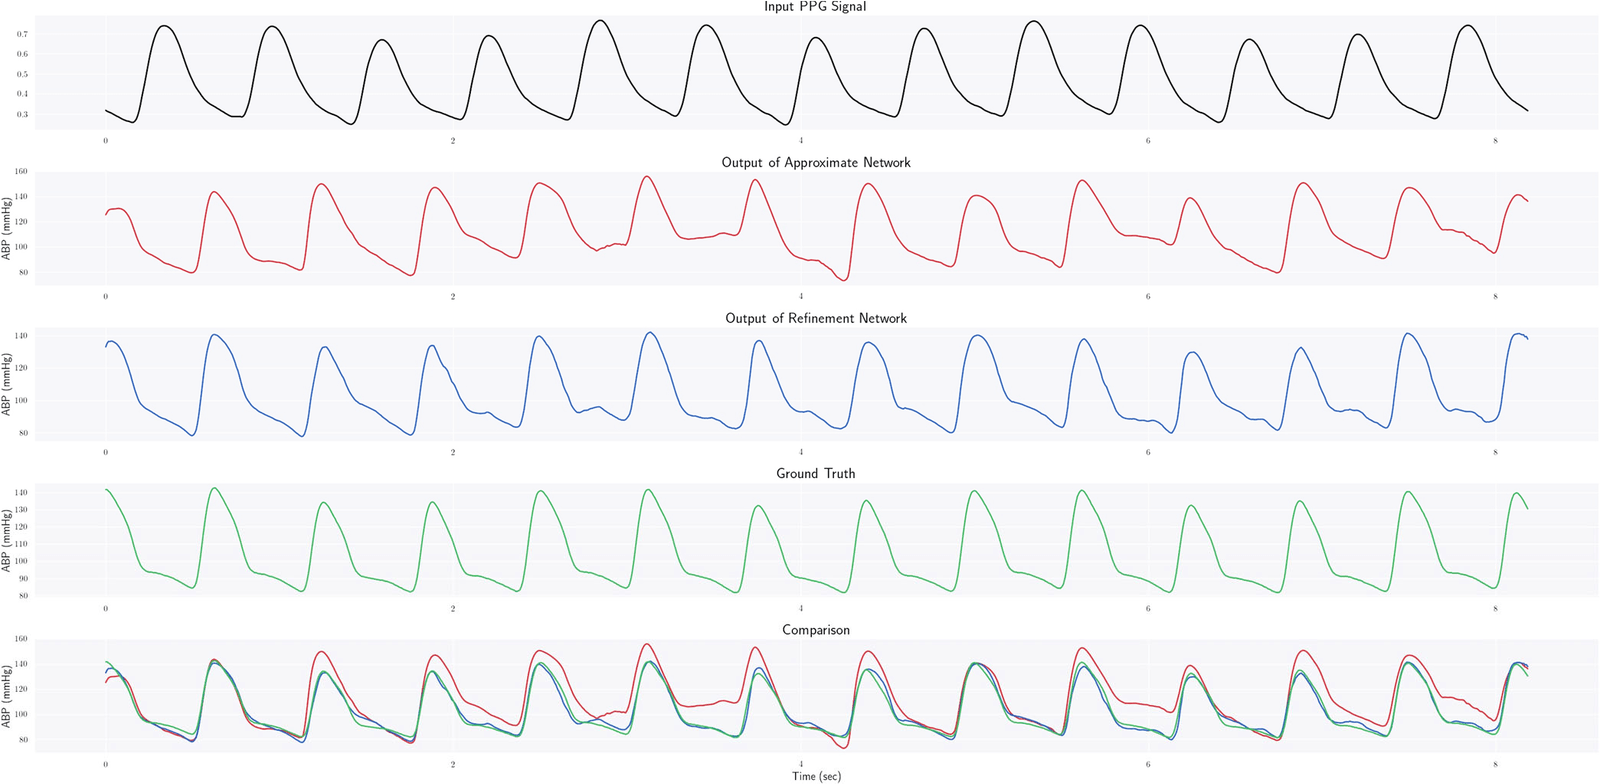
PPG2ABP reconstructs the continuous arterial pressure waveform from PPG without ECG. A deeply supervised 1D U-Net first approximates the waveform, and a 1D MultiResUNet then refines it. Systolic, diastolic and mean pressure are read directly from the reconstructed signal, so the network is not trained on those values separately.
The model was evaluated on 127,260 segments from the UCI data, with an independent test part and lower-quality PPG kept in the data. Diastolic and mean pressure met BHS Grade A and the AAMI criteria. Systolic pressure reached Grade B, and its error spread was above the AAMI limit.
- Waveform mean absolute error
- 4.604 mmHg
- Mean arterial pressure error
- 2.310 mmHg
- Input signal
- PPG only
| Mean absolute error | Within 5 / 10 / 15 mmHg | BHS grade | AAMI | |
|---|---|---|---|---|
| Diastolic | 3.449 mmHg | 82.8% / 92.2% / 95.7% | A | Met |
| Mean arterial | 2.310 mmHg | 87.4% / 95.2% / 97.7% | A | Met |
| Systolic | 5.727 mmHg | 70.8% / 85.3% / 90.9% | B | Not met |


Combining pressure prediction with waveform reconstruction
Biomedical Signal Processing and Control · 2023
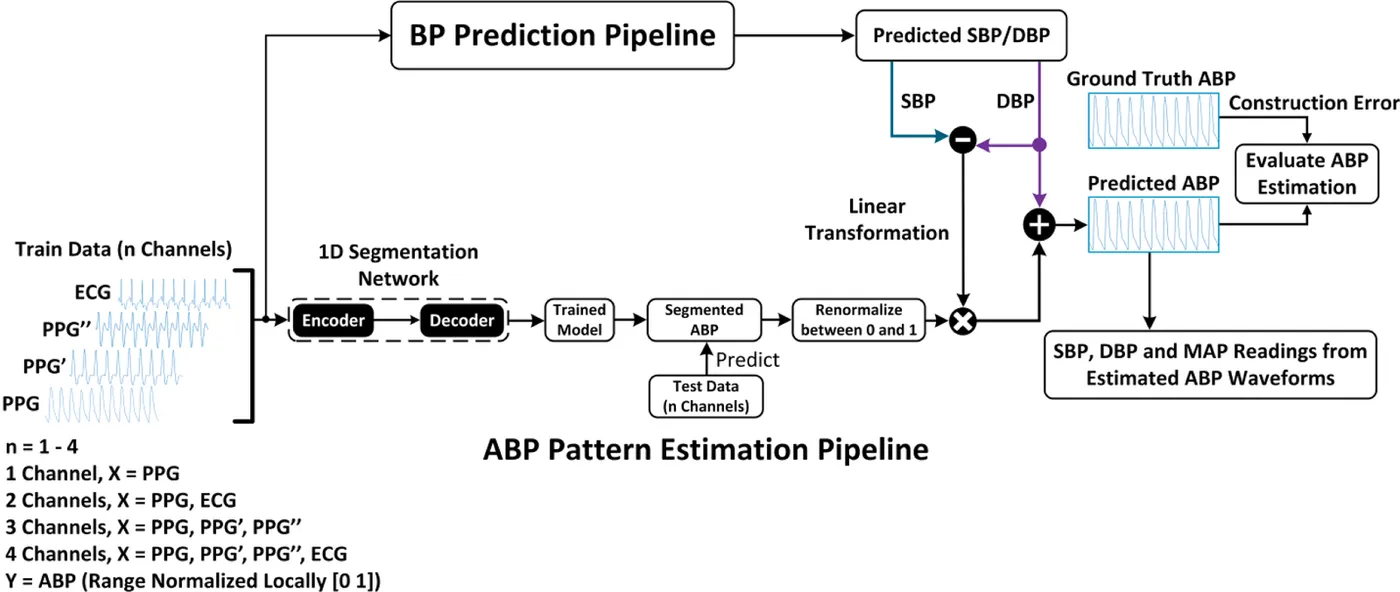
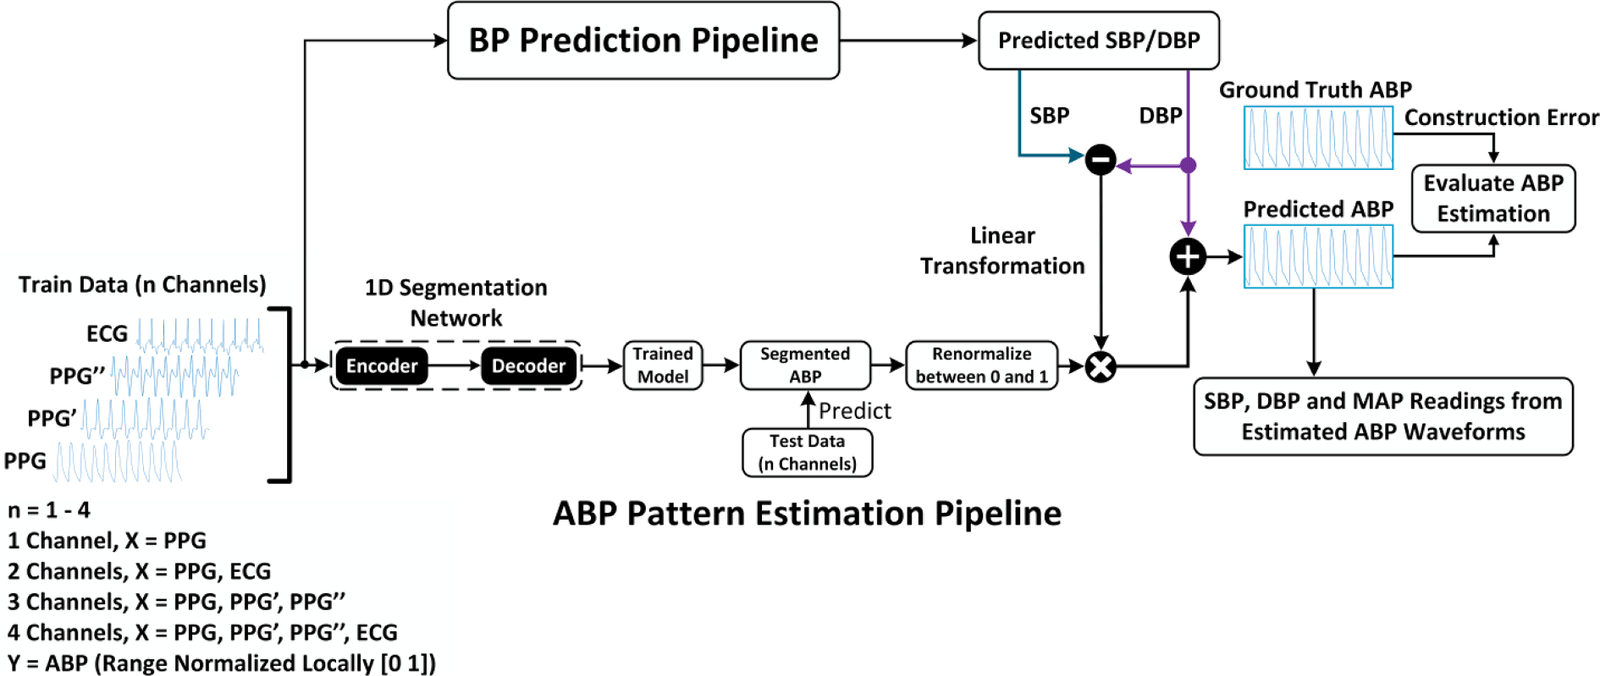
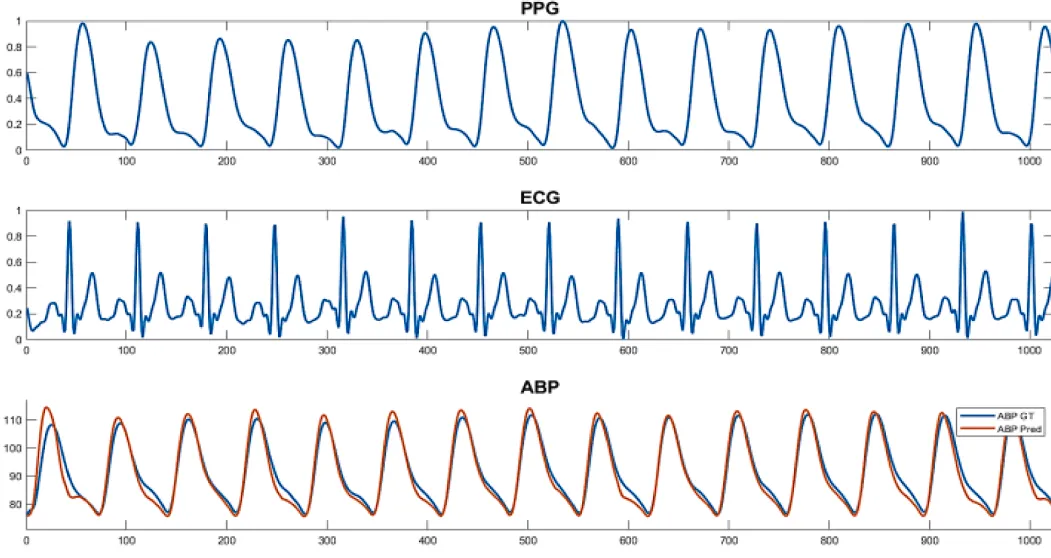
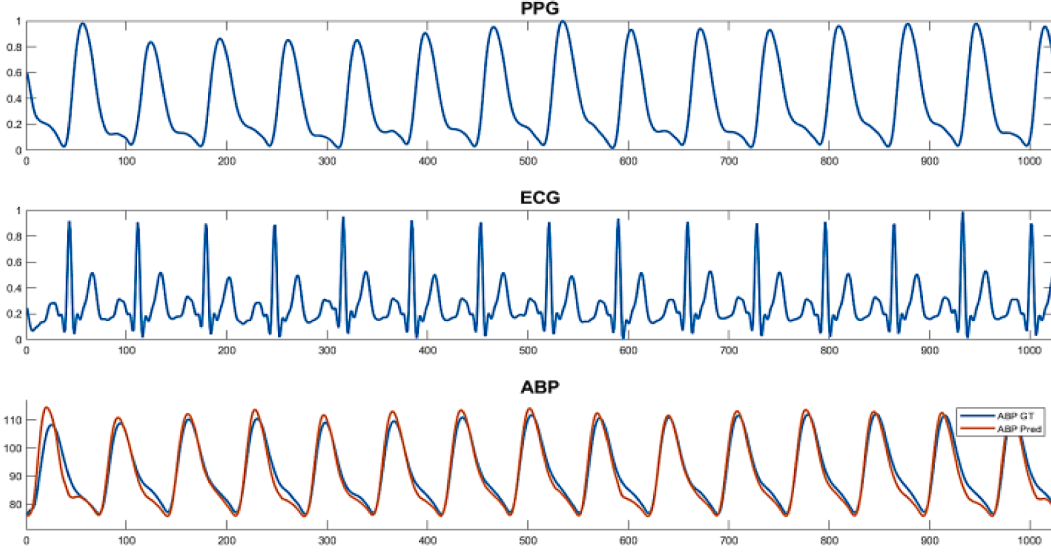
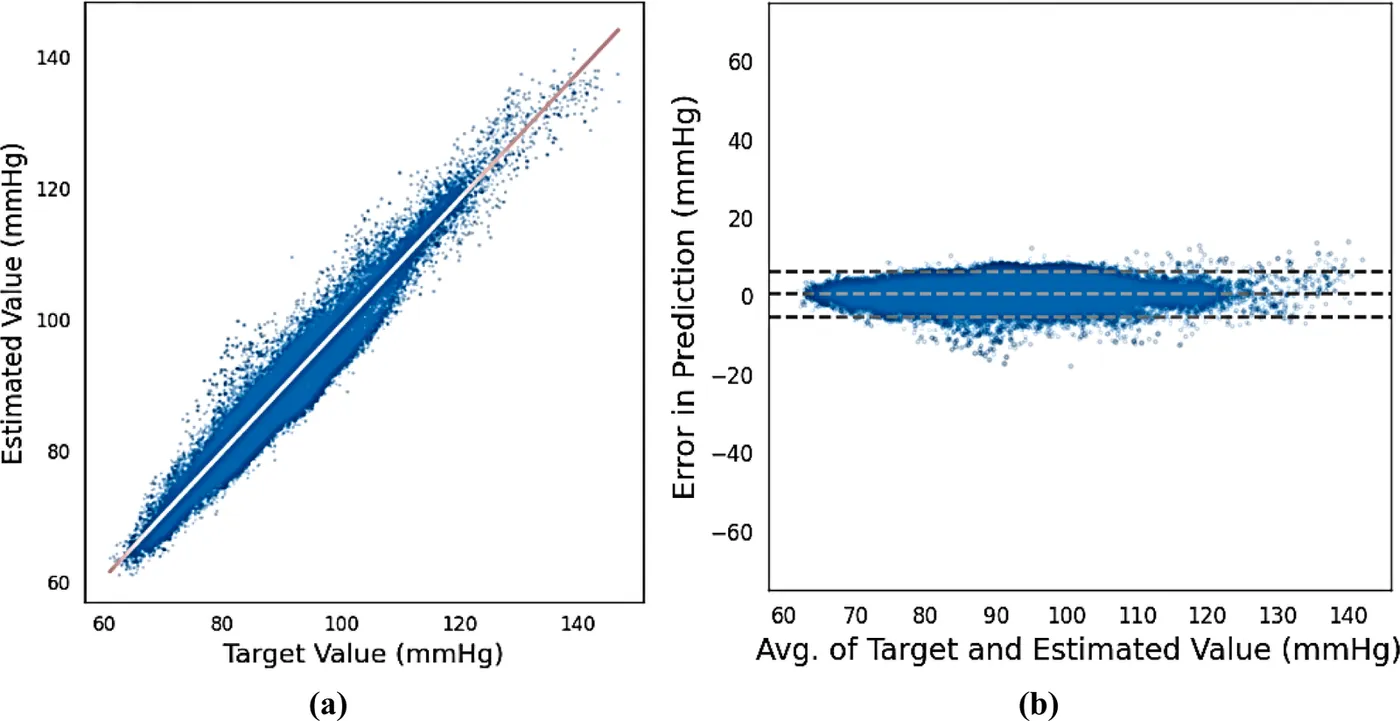
Segmentation networks learn waveform shape best from normalised signals, but normalisation removes absolute pressure. This study separated the two tasks. The shallow U-Net pipeline predicted systolic and diastolic pressure, a new network estimated the normalised waveform, and a linear transformation restored its scale.
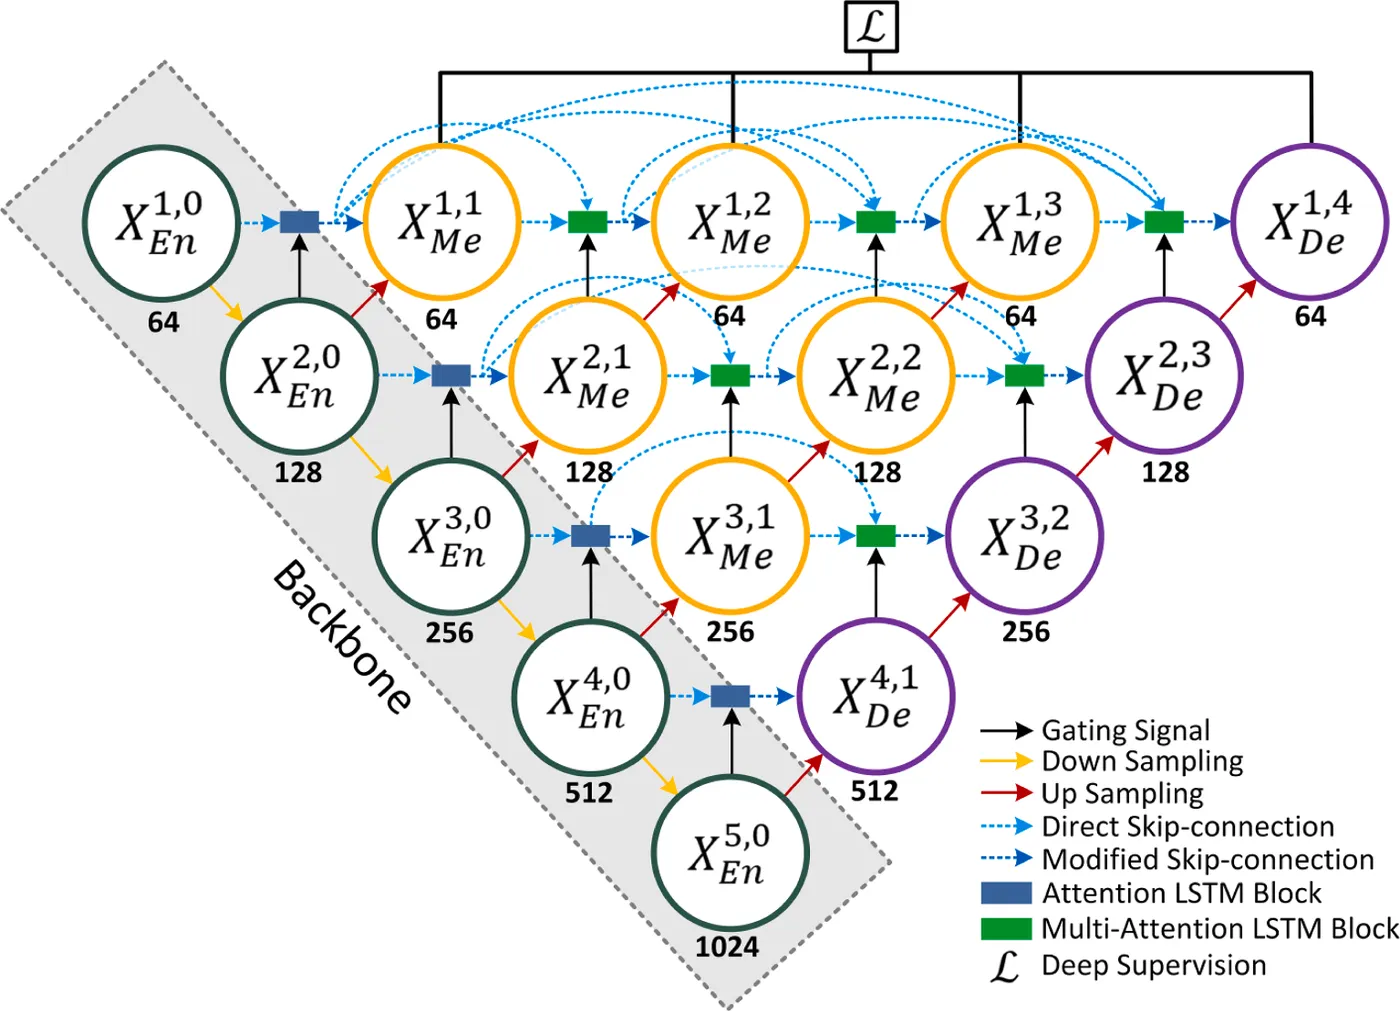
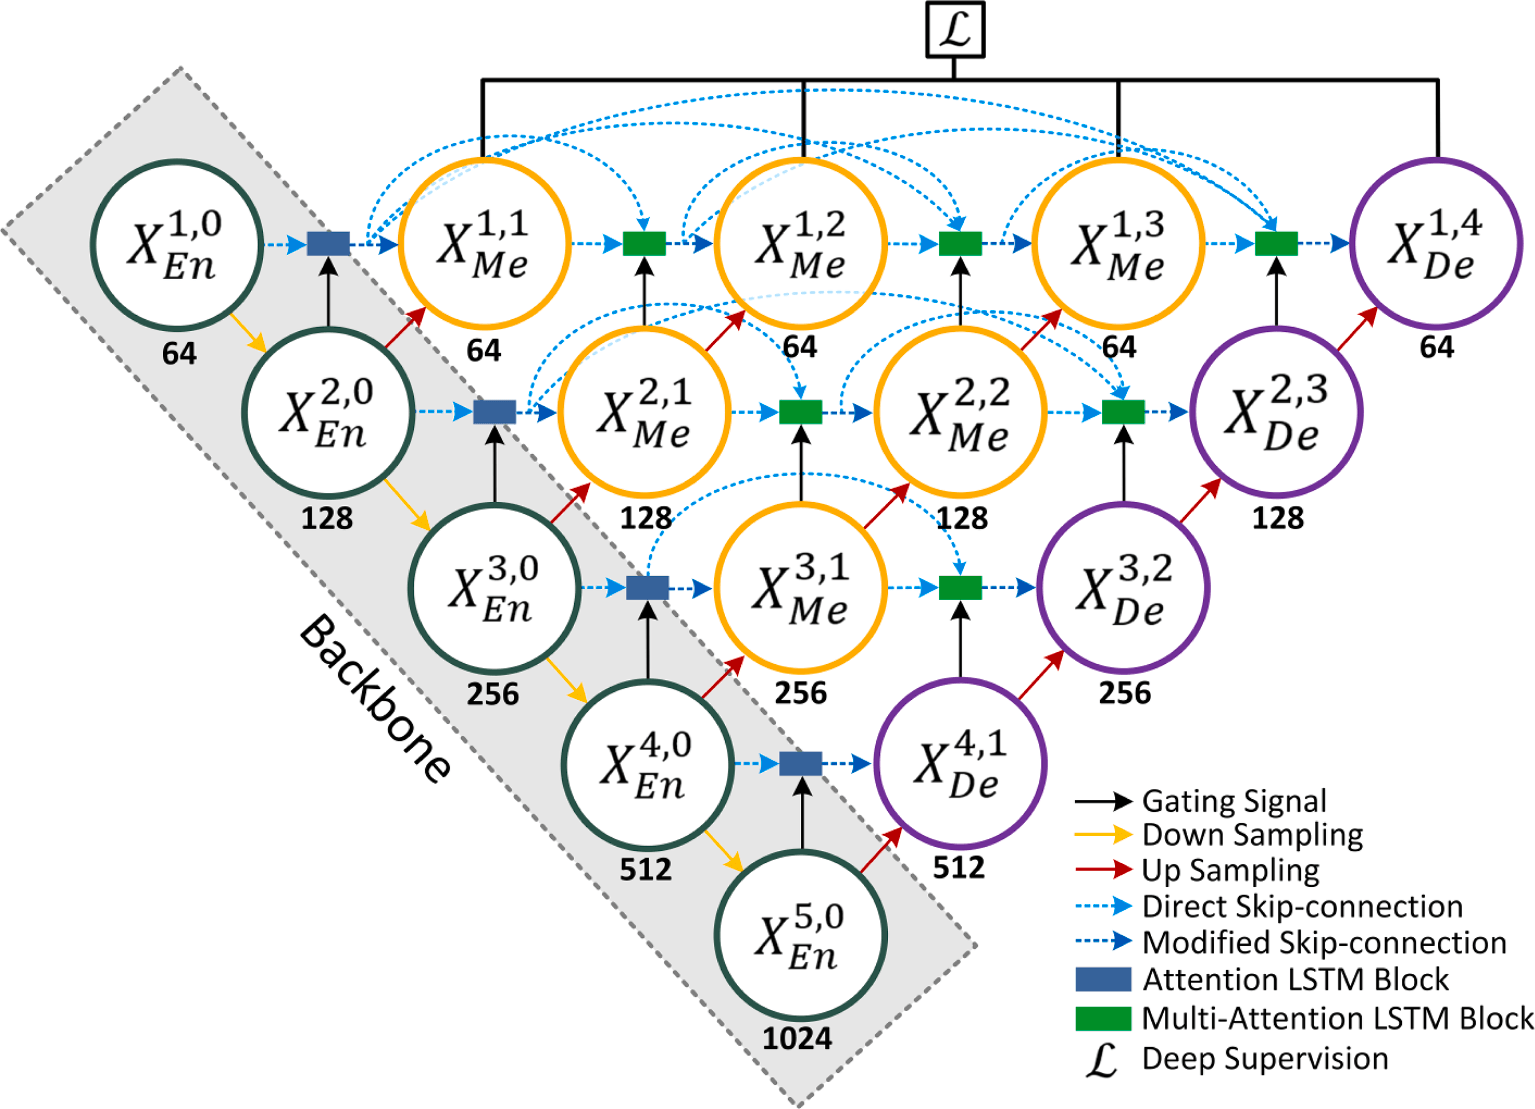
NABNet extends UNet++ with attention-guided bidirectional ConvLSTM blocks in its skip connections, which help it handle timing shifts between PPG, ECG and arterial pressure. It was evaluated with four-fold cross-validation on 191,198 segments, or about 435 hours of signals, against ten other segmentation networks.
The final waveforms kept the prediction accuracy of the first stage, with about 92% of systolic and 99% of diastolic values within 5 mmHg. Compared with PPG2ABP, the pipeline reduced systolic and diastolic error and gave a similar mean pressure error, although it also used ECG.
- Systolic mean absolute error
- 2.63 mmHg
- Diastolic mean absolute error
- 1.09 mmHg
- Mean arterial pressure error
- 2.37 mmHg
| Final waveform error | Mean pressure within 5 mmHg | |
|---|---|---|
| NABNet | 4.778 | 87.58% |
| Attention UNet | 4.784 | 86.46% |
| BCDUNet | 4.804 | 86.83% |
| UNet++ | 4.826 | 85.71% |
| UNet | 4.930 | 85.01% |
My contribution
For the shallow U-Net study, I led conceptualisation, methodology, software, formal analysis, investigation, data curation, validation, visualisation and manuscript preparation. For PPG2ABP, I contributed to data curation, formal analysis, methodology, investigation, validation and manuscript drafting and revision, and worked with the first author to rework the study for publication. For the combined pipeline, I led development and evaluation of NABNet, including data preparation, implementation, experiments, analysis, visualisation and manuscript preparation.
Study scope
All three studies were developed on the same public intensive-care dataset of clinical finger PPG, and distorted or extreme signals were excluded in two of them. Only the shallow U-Net study tested an external dataset, with 40 people. Motion artefacts from wearable sensors were not resolved, and PPG2ABP is not intended for wrist PPG. Prospective validation is needed before clinical use.
Publications
- NABNet: A Nested Attention-guided BiConvLSTM network for a robust prediction of Blood Pressure components from reconstructed Arterial Blood Pressure waveforms using PPG and ECG signalsBiomedical Signal Processing and Control · 2023
- A Shallow U-Net Architecture for Reliably Predicting Blood Pressure (BP) from Photoplethysmogram (PPG) and Electrocardiogram (ECG) SignalsSensors · 2022
- PPG2ABP: Translating Photoplethysmogram (PPG) Signals to Arterial Blood Pressure (ABP) WaveformsBioengineering · 2022