Physiological signal processing · 2024
QU-GM: IoT-based glucose monitoring from wrist PPG, blood pressure and demographic data
A wearable and cloud-connected system that uses machine learning to estimate blood glucose and classify glucose severity without a finger-prick input.
Qatar National Research Fund NPRP13S-0205-200270 · Qatar Diabetic Society
Approach
Can wrist PPG, blood pressure and demographic information support real-time glucose estimation without a blood sample?
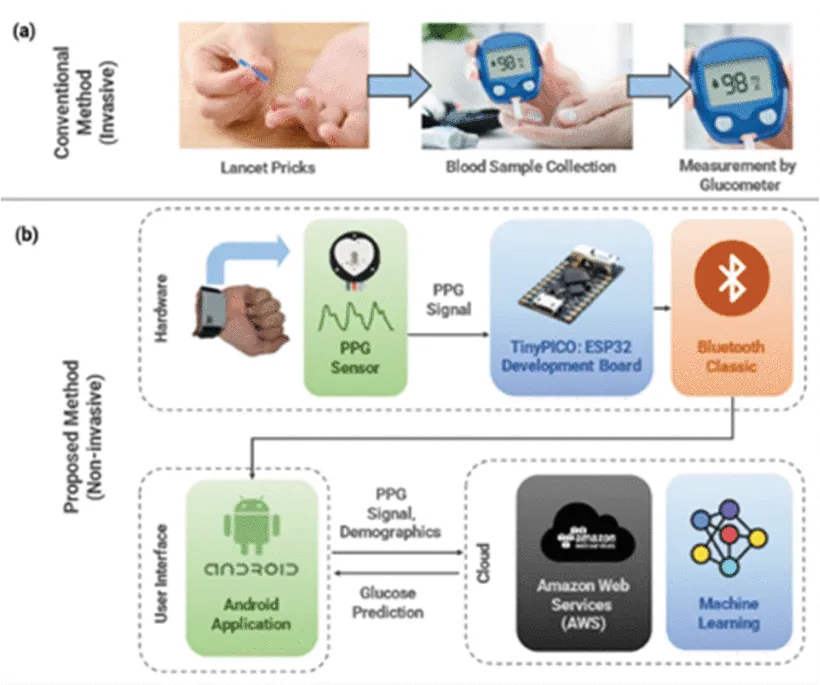
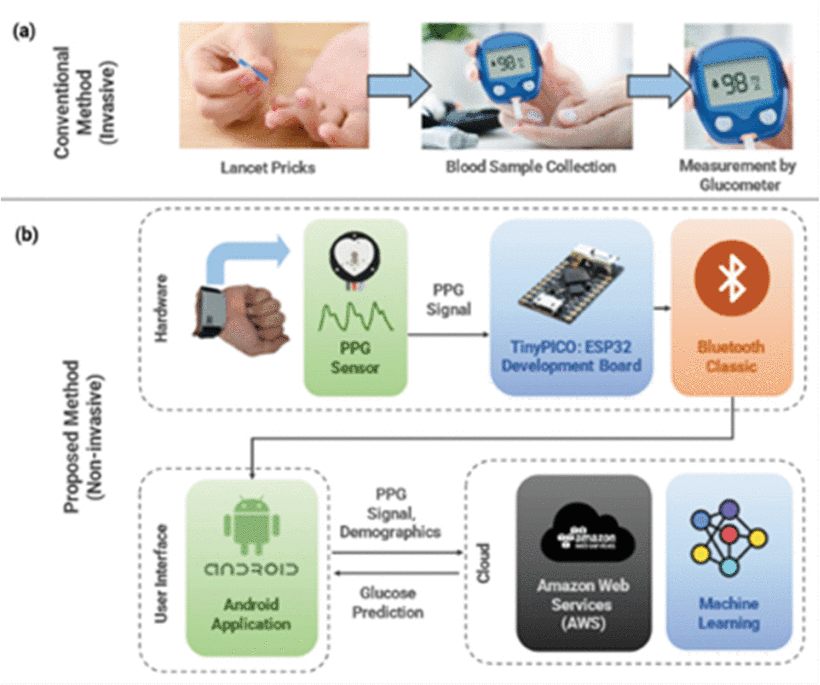
Finger-prick meters require repeated blood samples, and continuous glucose monitors use a sensor placed under the skin. QU-GM explores a less invasive route by combining a custom PPG wristband with blood pressure, demographic information and machine learning. The complete system links the wearable, an Android application and cloud-hosted models for glucose estimation and severity classification.
- Record wrist PPG and user data
- Estimate glucose and severity
- Return results to the application
Building the wristband and connected system
Hardware, mobile application and cloud
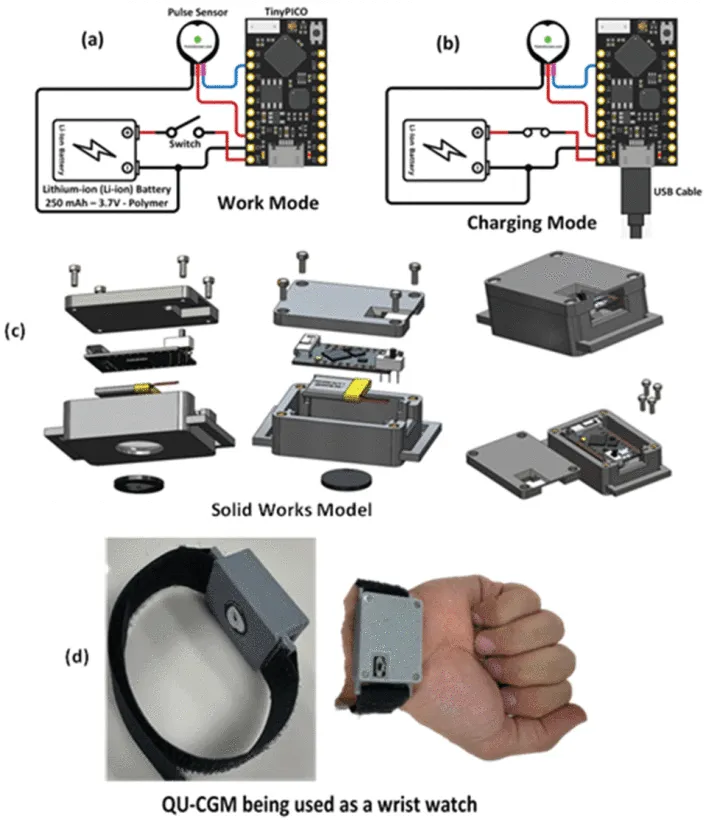
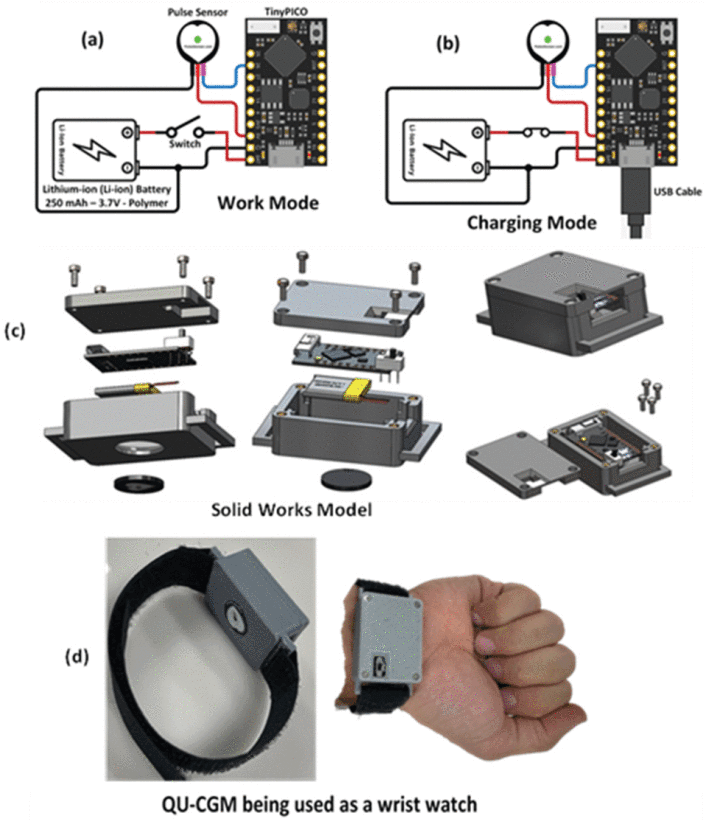
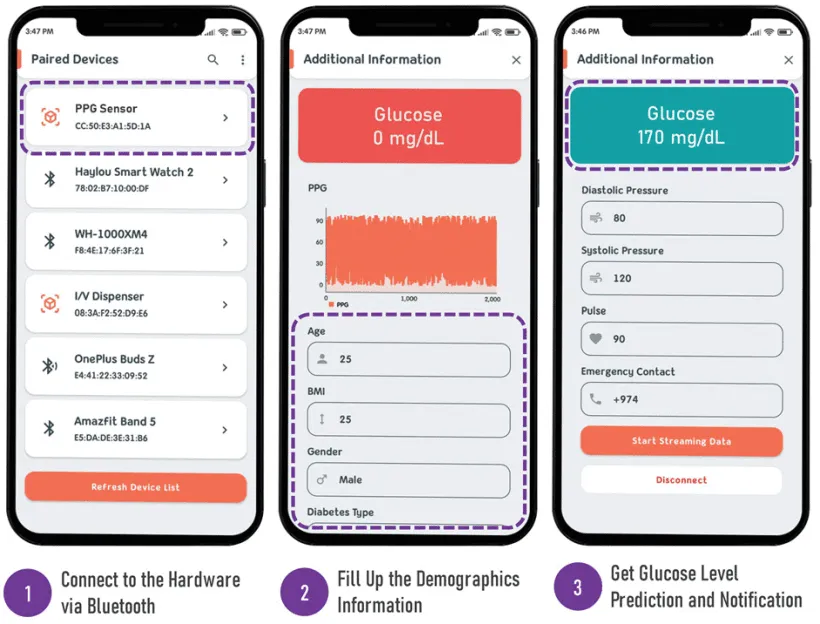
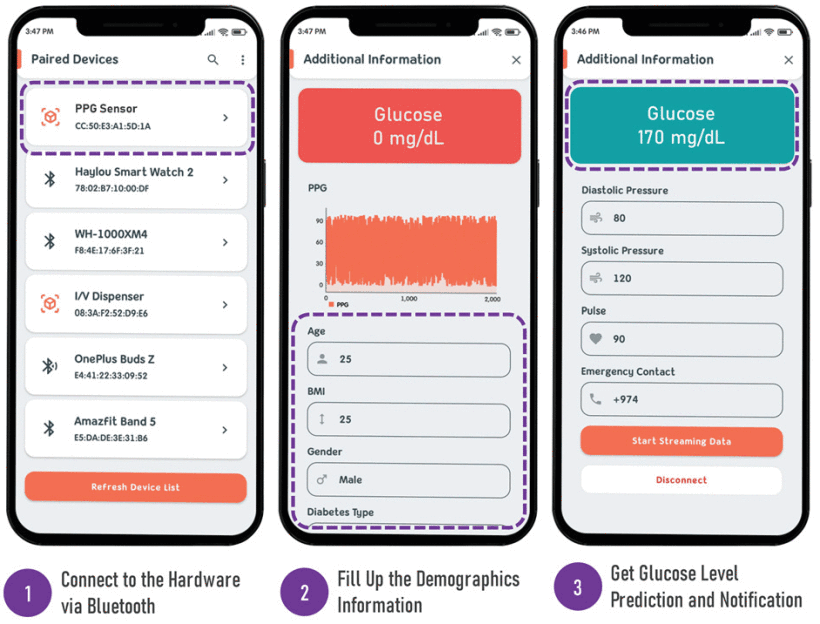
The wristband measures about 30 × 42 mm and combines a 609 nm pulse sensor, a TinyPICO ESP32 microcontroller and a 250 mAh battery that can last up to 24 hours. It samples PPG at 125 Hz and streams the signal to an Android application over Bluetooth.
The application combines PPG with blood pressure and demographic details, then sends the data to models hosted on Amazon Web Services. Estimated glucose and severity return to the phone every 10 seconds, and the design includes alerts for abnormal values.
- Wristband size
- 30 × 42 mm
- PPG sampling rate
- 125 Hz
- Result update interval
- 10 s
Collecting clinical data and engineering features
Qatar Diabetic Society · 139 participants
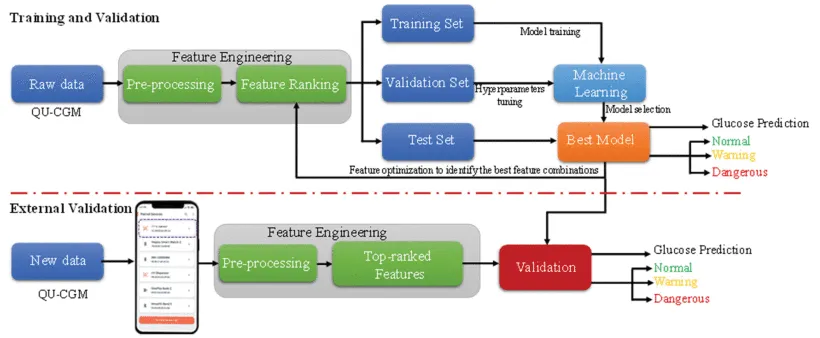
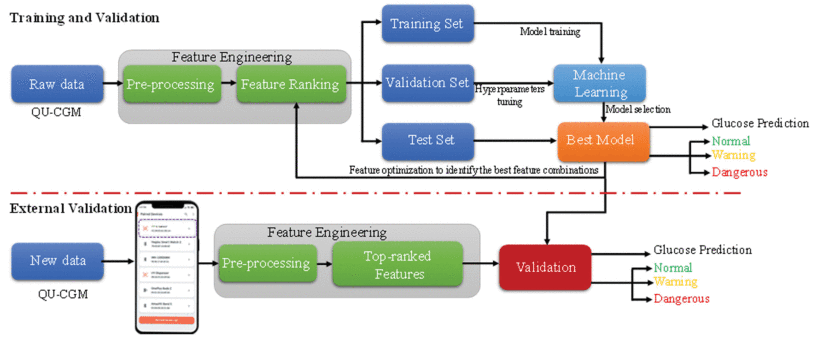
Three minutes of resting wrist PPG were recorded from each of 139 participants, with finger-prick glucose from an Accu-Chek meter and blood pressure and heart rate from an Omron monitor. The study had ethical approval from Hamad Medical Corporation, and all participants gave written informed consent.
Signals were filtered, cleaned with variational mode decomposition and divided into 4.096-second segments. The pipeline extracted 139 time-domain, statistical, Mel-frequency cepstral, demographic and clinical features. Removing highly correlated features left 78 for model selection.
| Value | |
|---|---|
| Participants | 139 |
| With diabetes | 49.65% |
| Female | 41.84% |
| Age | 13–87 years (43) |
| Body mass index | 16.61–45.99 kg/m² (26.67) |
| Blood glucose | 66–600 mg/dL (118) |
Estimating blood glucose on unseen participants
Regression with separate test participants
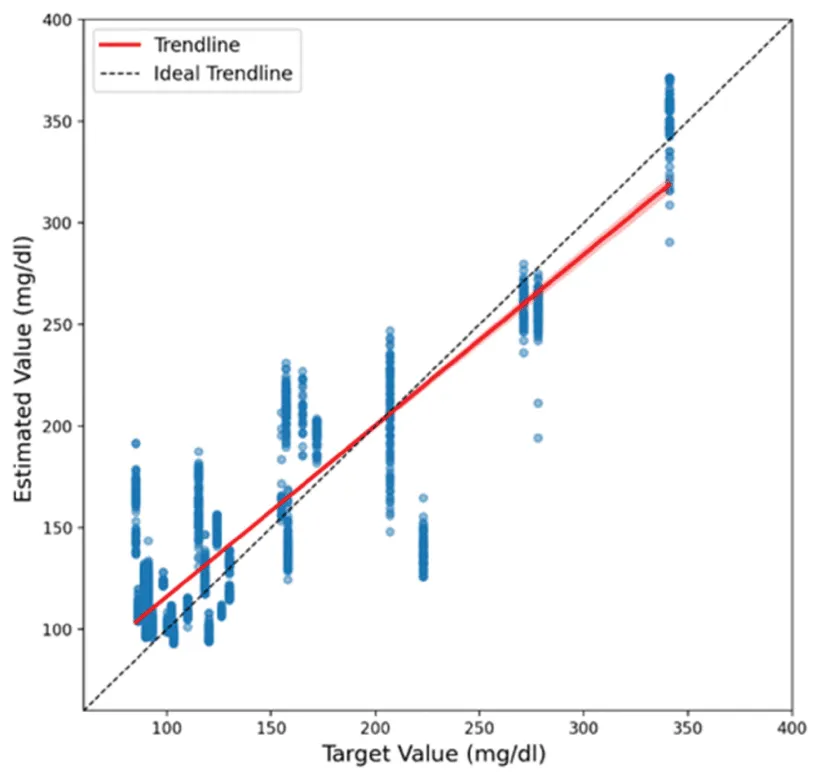
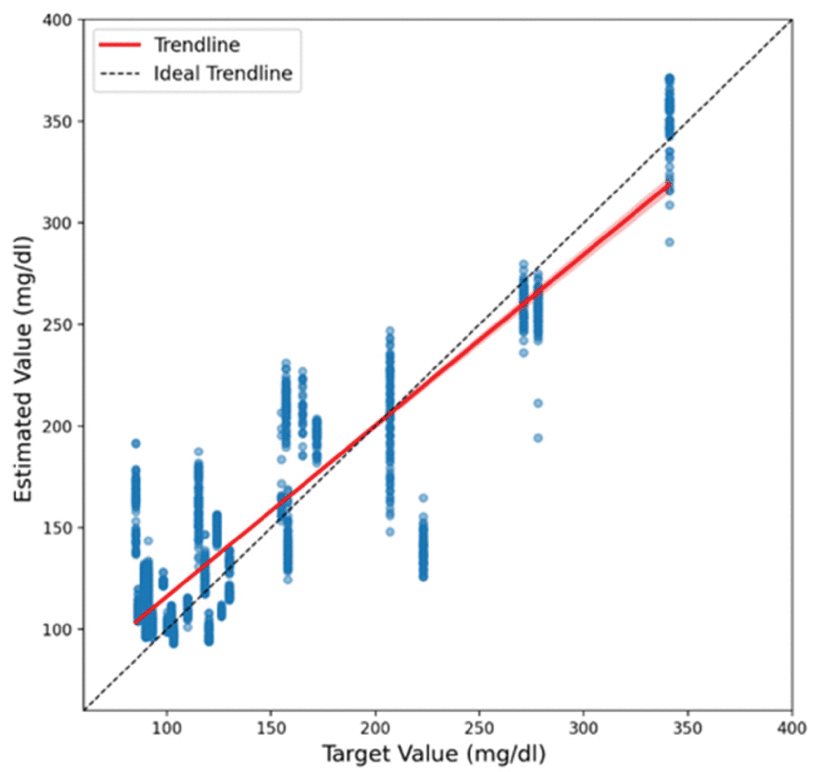
Participants were divided into separate training, validation and test groups in a 60:20:20 ratio. Three feature selection methods were compared with Gaussian process regression, decision trees and bagged ensemble trees. Bagged ensemble trees with 44 features selected by minimum redundancy maximum relevance gave the best result.
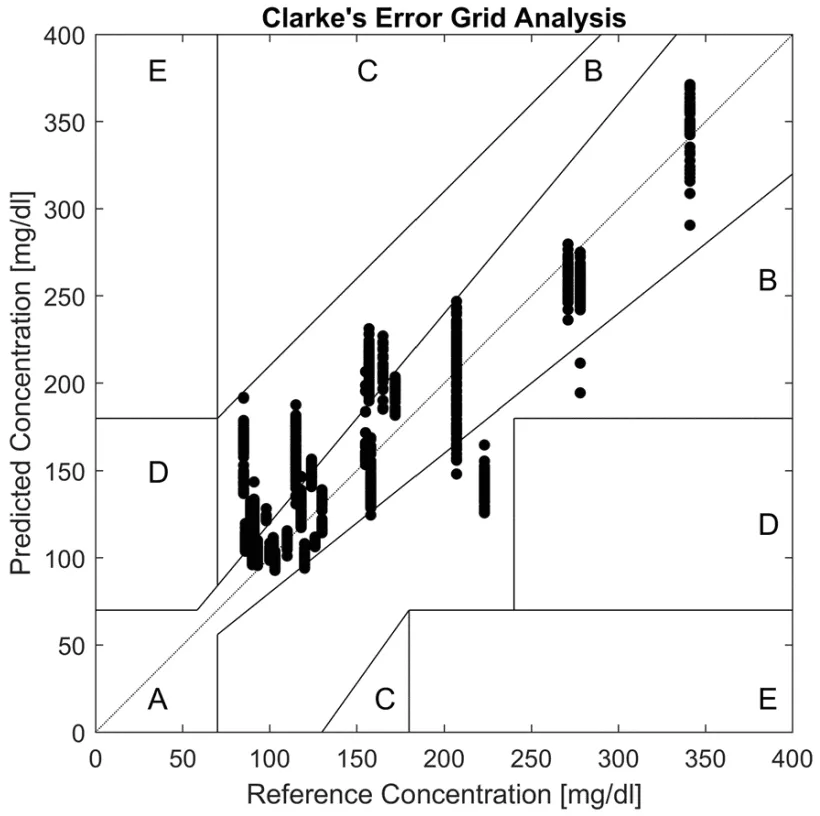
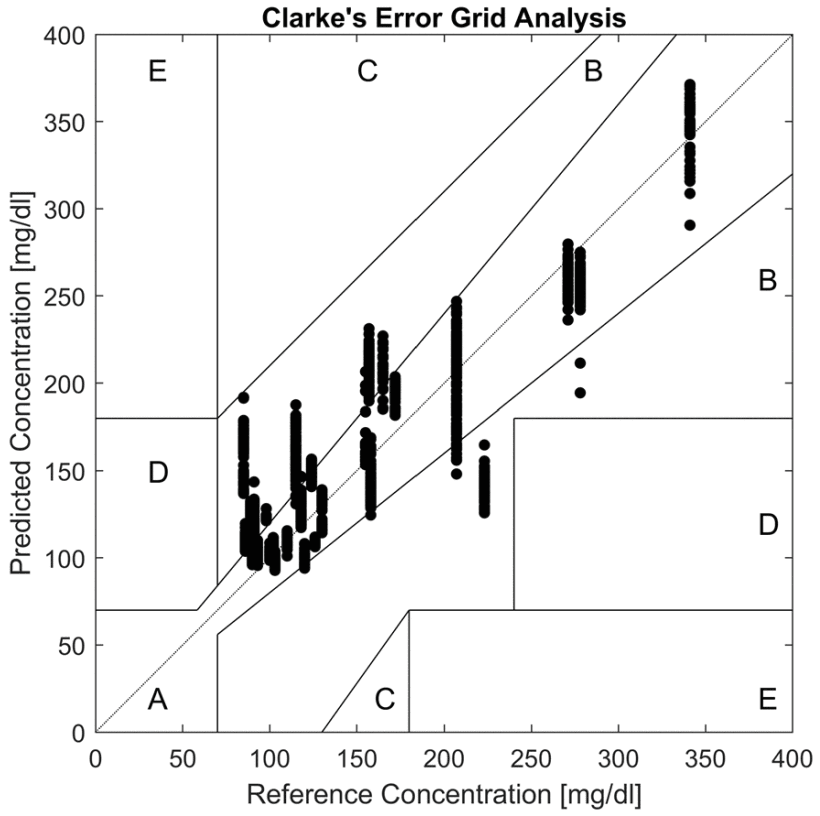
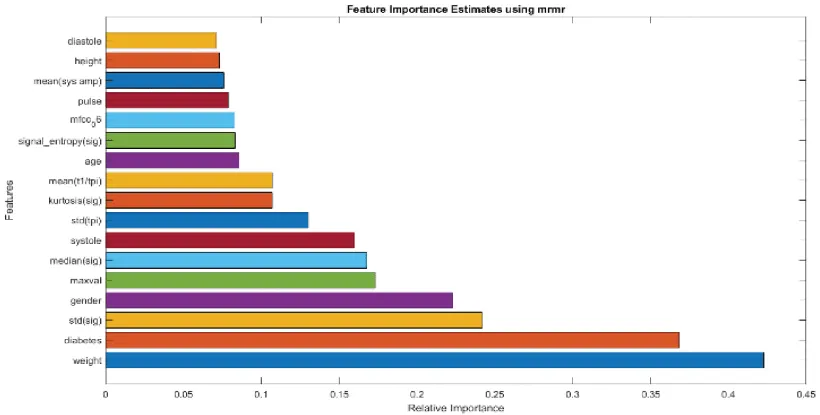
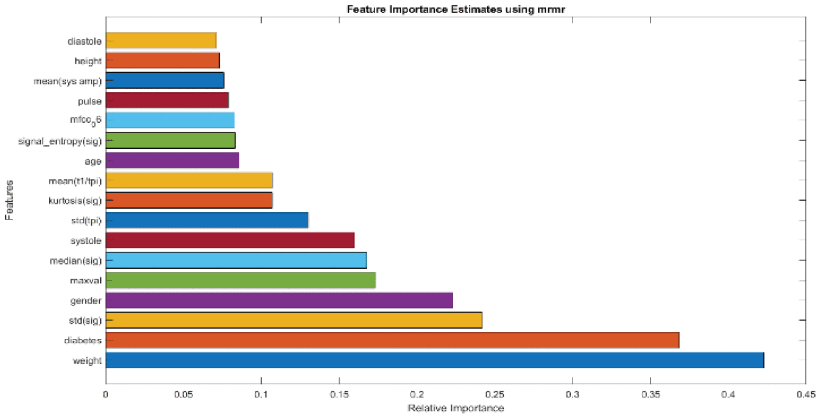
Demographic and clinical variables ranked among the most important features, alongside PPG-derived measures. On the Clarke Error Grid, 61.88% of predictions fell in zone A and 38.12% in zone B, with none in zones C, D or E.
- Correlation with measured glucose
- 0.90
- Mean absolute error
- 22.90 mg/dL
- Predictions in Clarke zones A and B
- 100%
| Features | Correlation | Mean absolute error | RMSE | |
|---|---|---|---|---|
| Bagged trees with MRMR | 44 | 0.90 | 22.90 mg/dL | 30.74 mg/dL |
| Bagged trees with ReliefF | 52 | 0.88 | 24.34 mg/dL | 32.15 mg/dL |
| Bagged trees with CFS | 53 | 0.87 | 23.70 mg/dL | 32.56 mg/dL |
| Gaussian process with ReliefF | 48 | 0.81 | 30.11 mg/dL | 40.77 mg/dL |
| Decision tree with MRMR | 56 | 0.76 | 35.73 mg/dL | 49.44 mg/dL |
Classifying glucose severity
Three-class classification
A second model placed each sample into normal, warning or dangerous groups using measured glucose ranges. K-nearest neighbours, support vector machines and decision trees were compared with stratified five-fold cross-validation on 12,399 samples. K-nearest neighbours with 17 selected features performed best, using time-domain, statistical, Mel-frequency and demographic information.
- Accuracy
- 98.12%
- F1 score
- 98.12%
- ROC AUC
- 0.998
| Blood glucose range | |
|---|---|
| Normal | 66–109.8 mg/dL |
| Warning | 109.8–140.4 mg/dL |
| Dangerous | 140.4 mg/dL and above |
My contribution
I contributed to the machine learning and physiological signal analysis for the glucose monitoring framework, including technical evaluation and manuscript review.
Study scope
The models were developed on 139 participants recorded at rest, so larger and more diverse cohorts are needed. Blood pressure is currently measured separately and entered in the application. Severity classification used stratified cross-validation across samples, and longer-term testing during daily use is still required before clinical use.