Medical imaging · 2023
Automated penile curvature measurement with deep learning
Measuring penile curvature from 2D images with a localisation, segmentation and key-point pipeline, tested on 3D-printed models and compared with a clinical expert.
Qatar University and Sidra Medicine · Hamad Medical Corporation Medical Research Center grant 20841
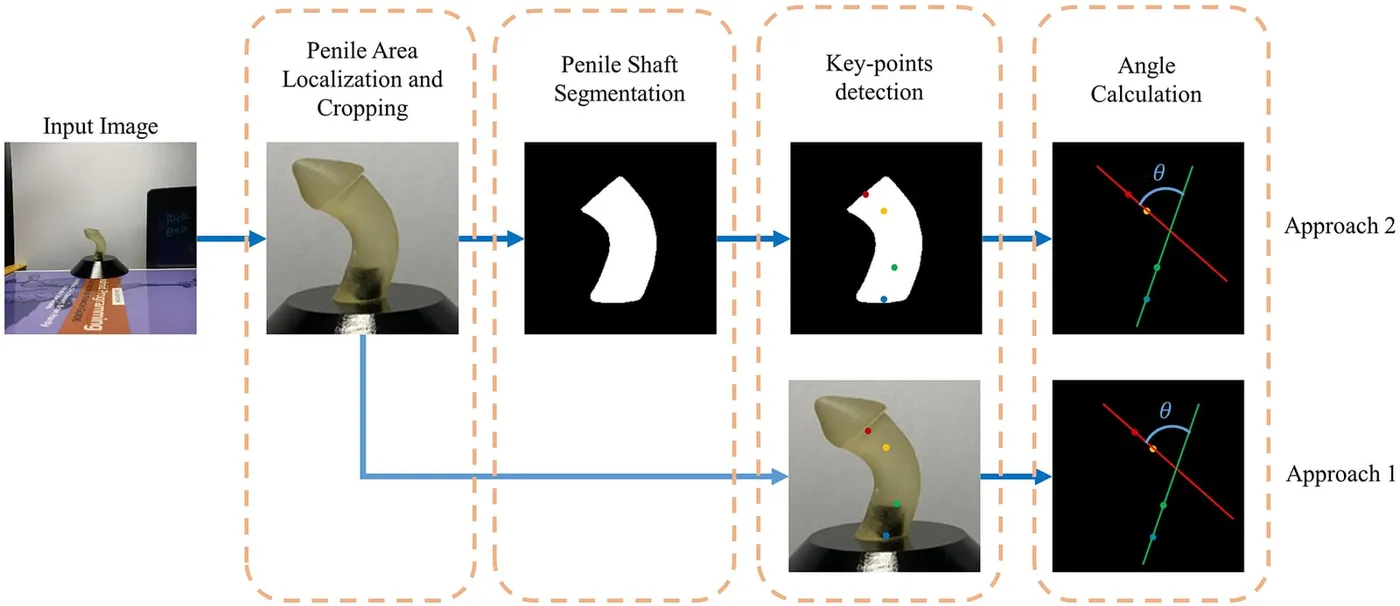
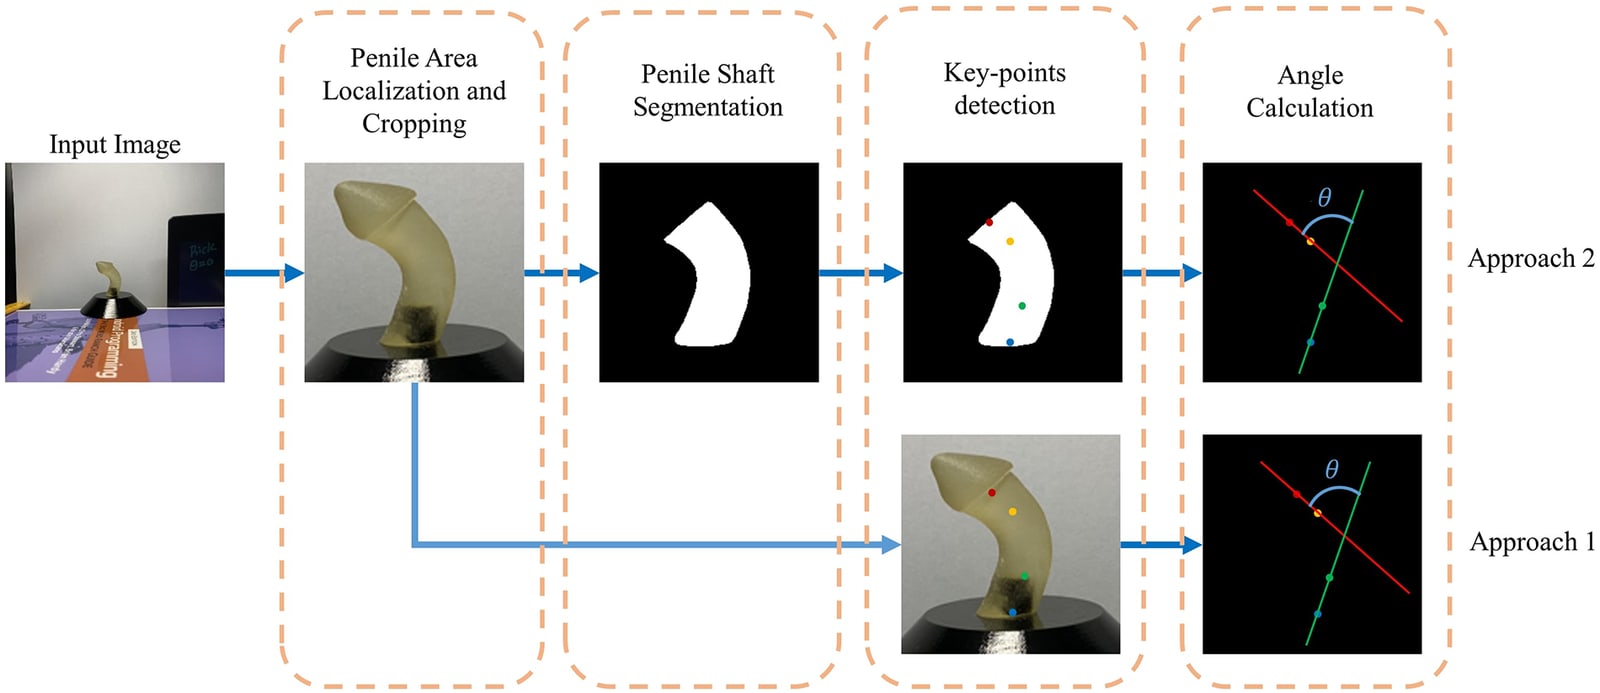
Approach
Can deep learning measure penile curvature from an ordinary image more consistently than visual assessment and manual tools?
Congenital penile curvature often accompanies hypospadias, which affects about 1 in 300 newborn boys, and the degree of curvature influences the choice of surgical repair. It is usually judged by eye, with a goniometer or with a phone application, and these measurements vary between observers. This study built an automated pipeline that measures the angle from a 2D image, replacing an earlier hard-coded angle calculation with learned anatomical key points.
- Localise and crop
- Segment the shaft
- Detect key points and calculate the angle
From a photograph to a curvature angle
Three deep learning stages
YOLOv5 first finds and crops the penile region. A UNet-based network then segments the shaft, and an HRNet model places four key points that mark the mid-axes of the distal and proximal shaft. The curvature is the angle between those two axes.
An earlier pipeline calculated the angle directly from the mask with hard-coded geometry, which failed on irregular shapes and near 90°. Key points avoid this and work for both hinge-type and arc-type curvature. Localisation reached 99.4% mAP at 0.5 overlap, and the best segmentation model, an ensemble UNet with a DenseNet121 encoder, reached a Dice score of 94.50%.
- Localisation mAP at 0.5 overlap
- 99.4%
- Shaft segmentation Dice
- 94.50%
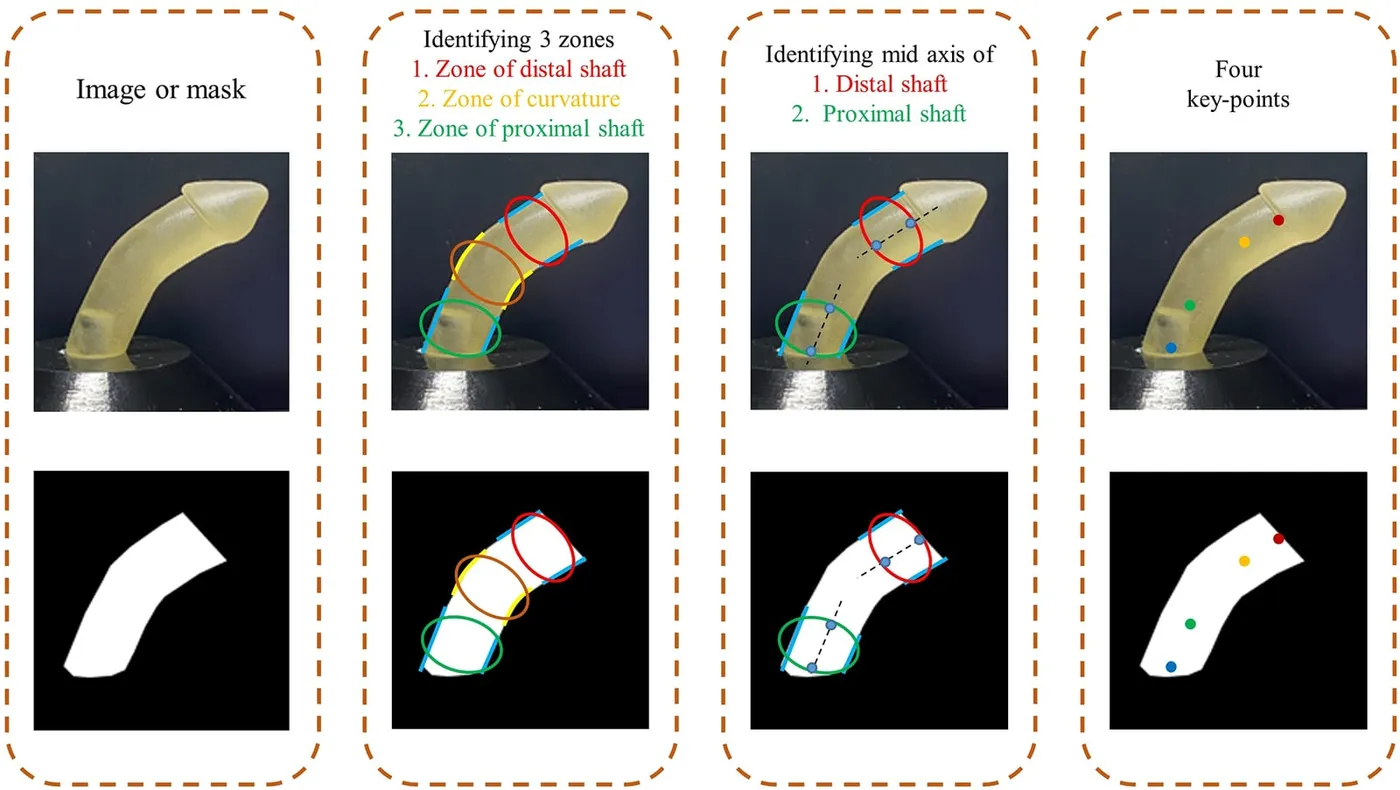
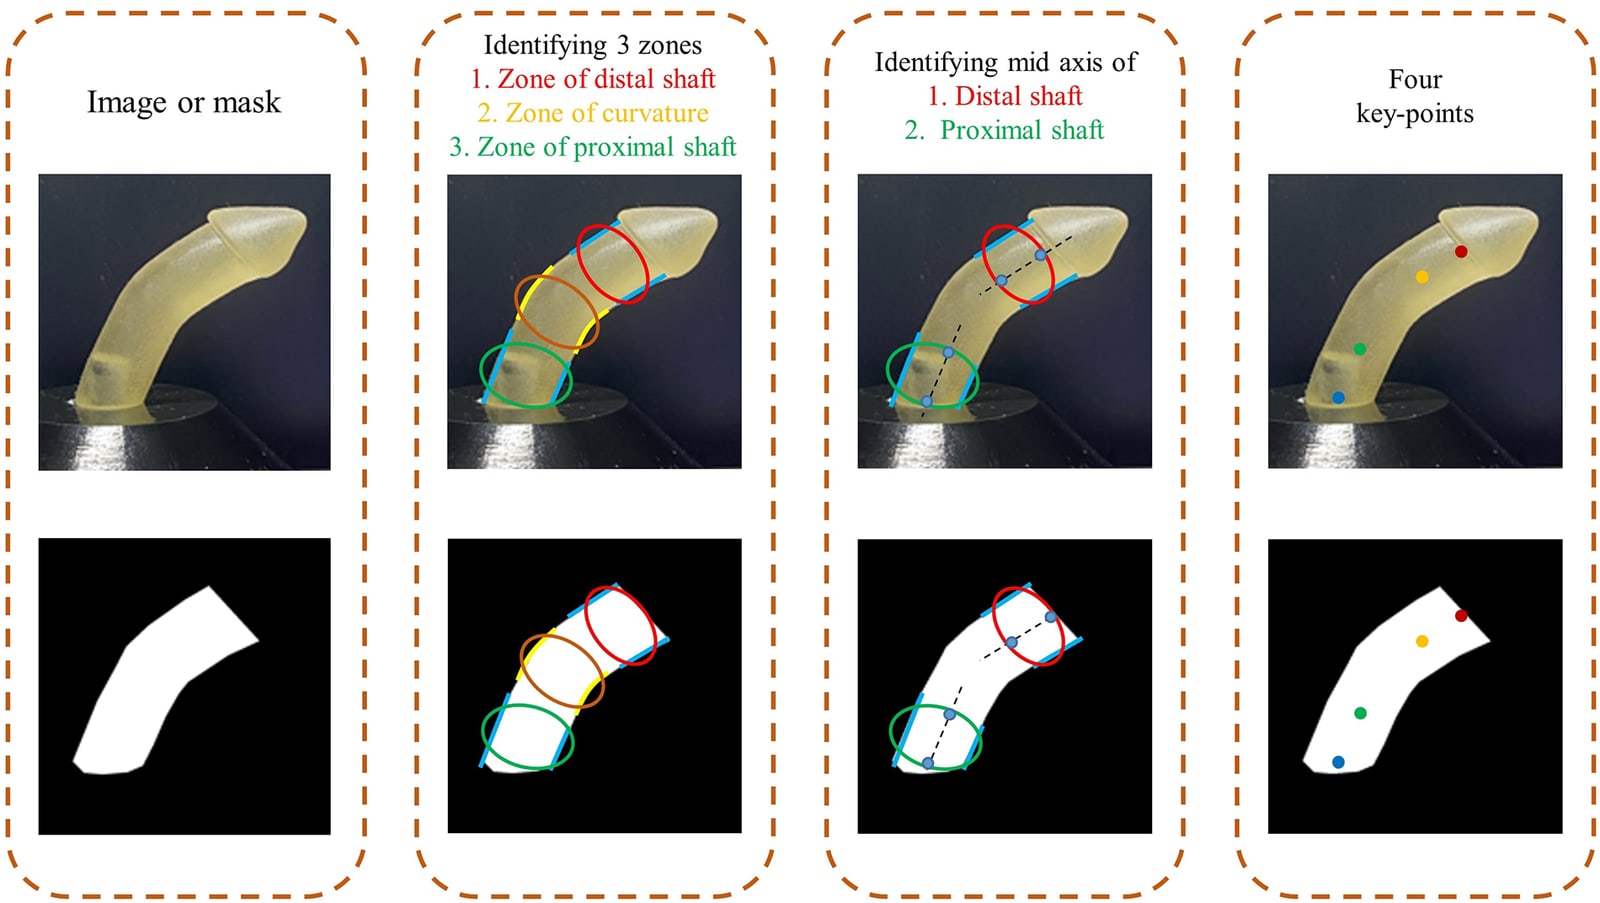
Accuracy on 3D-printed models
913 images · nine models · 18°–86°
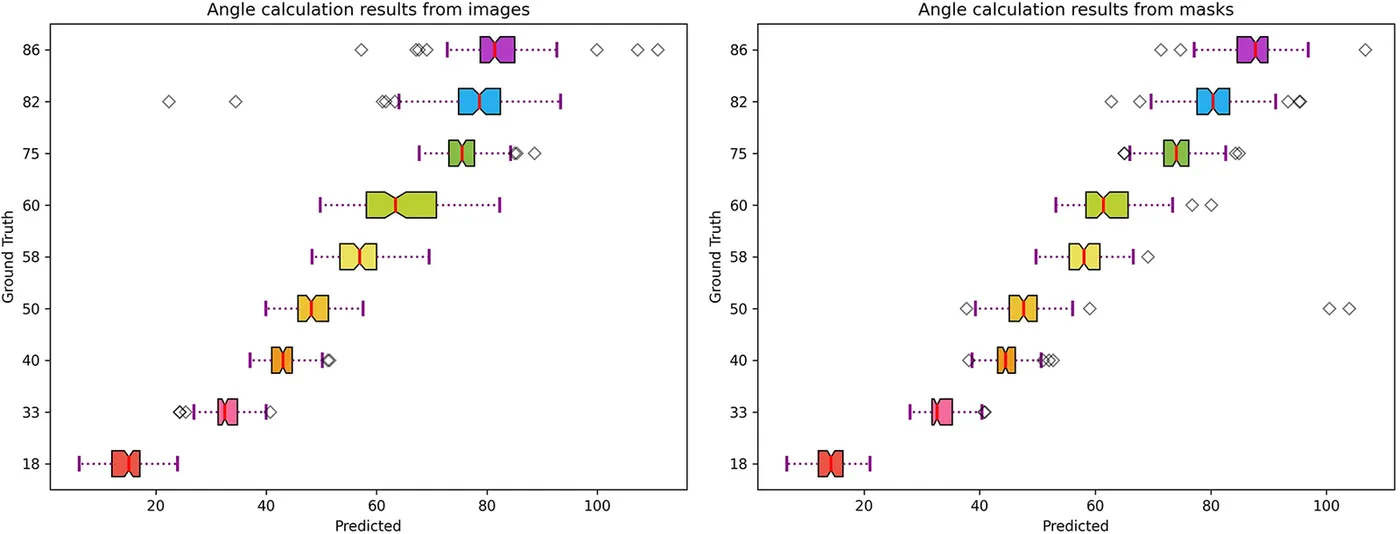
Nine 3D-printed models with known angles provided a reference that is difficult to obtain from patients. Key-point detection used nine-fold cross-validation, holding out one model at a time so that each was tested by a network not trained on it. Measuring from segmentation masks was more accurate and more consistent than measuring from the original images, and more than halved the error of the earlier pipeline on the same dataset.
- Mean absolute error from segmentation masks
- 3.81°
- Images of nine 3D-printed models
- 913
| Mean absolute error | |
|---|---|
| Earlier pipeline (Abbas et al.) | 8.53° |
| Key points from images | 4.52° |
| Key points from masks | 3.81° |
First comparison with a clinical expert
Four patient images
The model trained on 3D-printed models was then applied to shaft masks drawn by hand from four patient images. Its angles were compared with a clinical expert’s measurements made with a mobile angle application, and differed by 1.7° to 6.1°.
| Model estimate | Clinical expert | Difference | |
|---|---|---|---|
| Patient 1 | 17.75° | 23.82° | 6.07° |
| Patient 2 | 28.30° | 29.99° | 1.69° |
| Patient 3 | 64.43° | 69.79° | 5.36° |
| Patient 4 | 42.73° | 44.93° | 2.20° |
My contribution
I assisted with the experimental work on automated curvature measurement and contributed to preparing and revising the manuscript.
Study scope
The main evaluation used 3D-printed models under controlled conditions. The patient comparison covered four images with hand-drawn masks, and camera angle, image quality and surgical field conditions can affect the result. Clinical use would need a larger patient dataset and a segmentation step validated on real anatomy.
Publications
- Automated measurement of penile curvature using deep learning-based novel quantification methodFrontiers in Pediatrics · 2023