Biomedical devices & simulation · 2021–2024
Computational and AI methods for total hip implants
Finite element modelling, implant sensing, biomaterial and design reviews, and deep learning for detecting aseptic loosening in total hip replacement.
Qatar University, Universiti Kebangsaan Malaysia and clinical collaborators · Qatar National Research Fund NPRP11S-0102-180178
Approach
How can computational modelling and AI improve implant design, monitoring and detection of failure after total hip replacement?
Hip implants can fail through loosening, wear, stress shielding and poor load transfer. This project addressed those problems from several directions: detecting loosening on X-rays, reviewing materials and implant designs, simulating an implantable sensor, designing a spiral head–stem junction, and comparing stem materials in the implanted femur.
- Detect loosening on X-rays
- Review materials and designs
- Model sensing, wear and load transfer
Detecting aseptic loosening from hip X-rays
IEEE Access · 2022
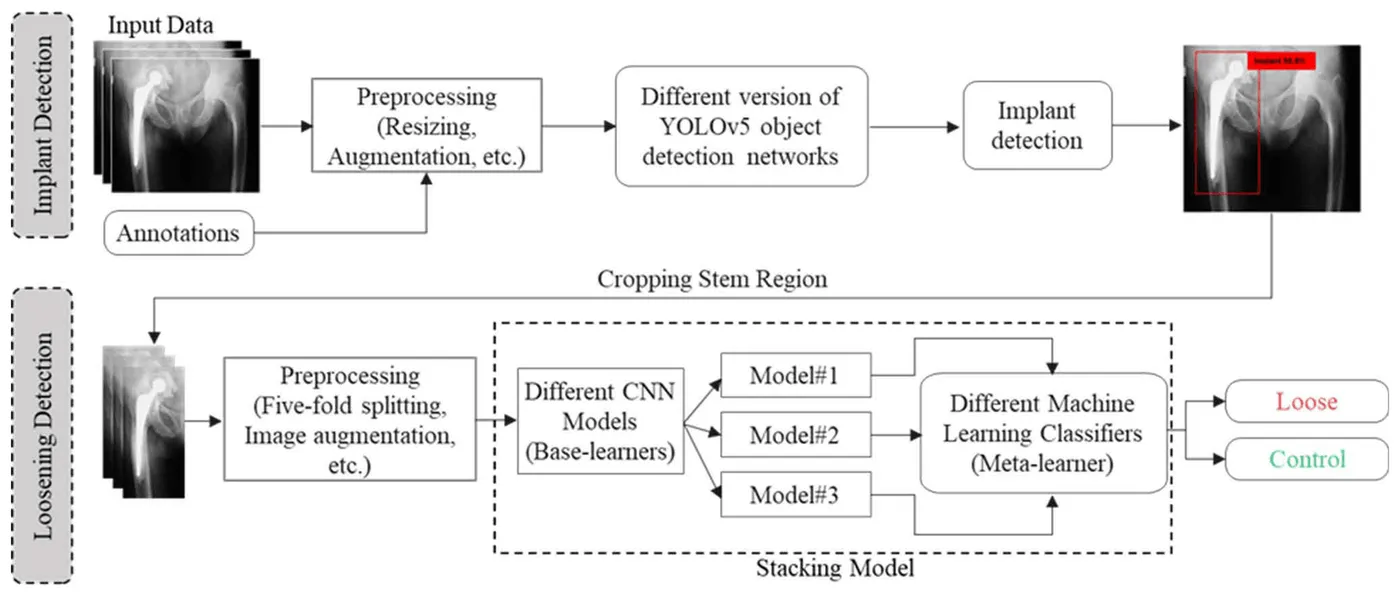
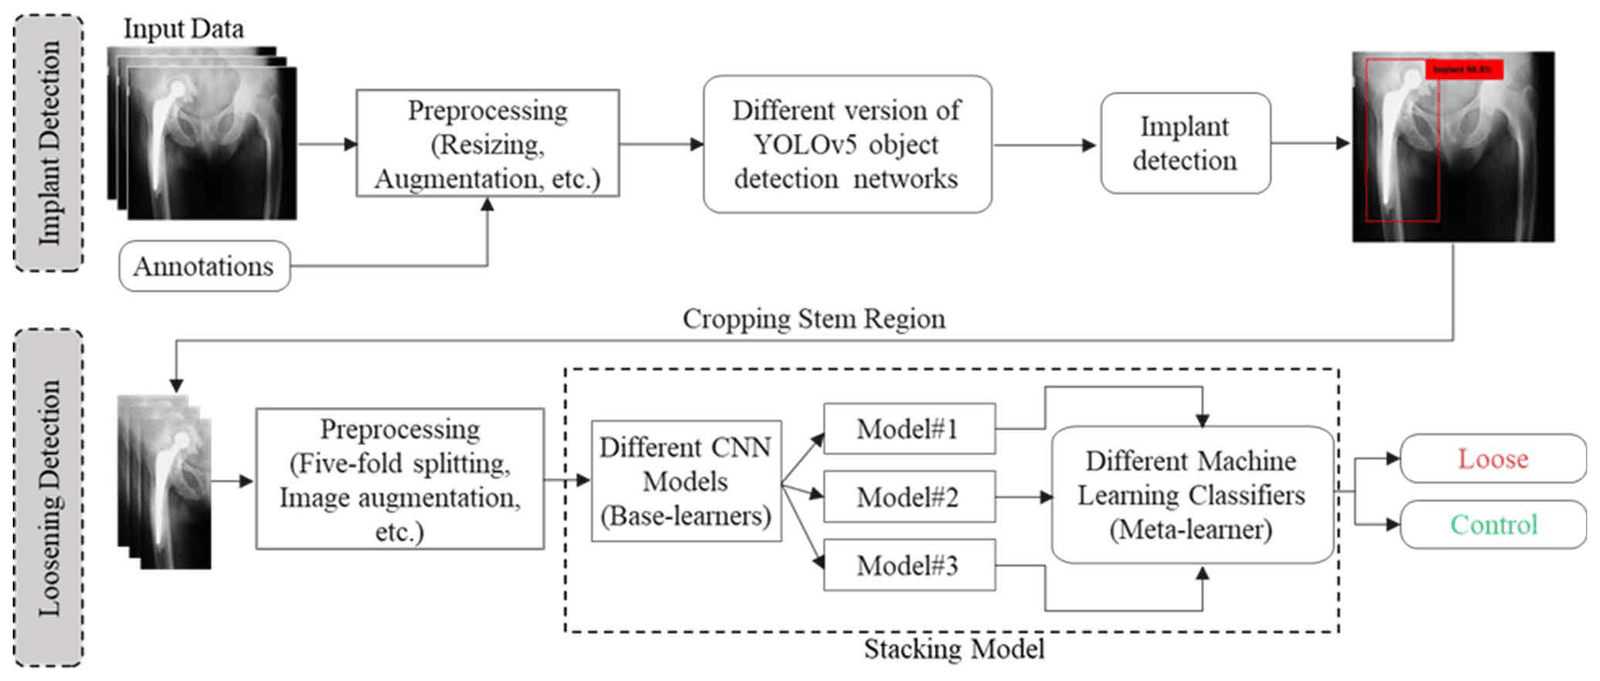
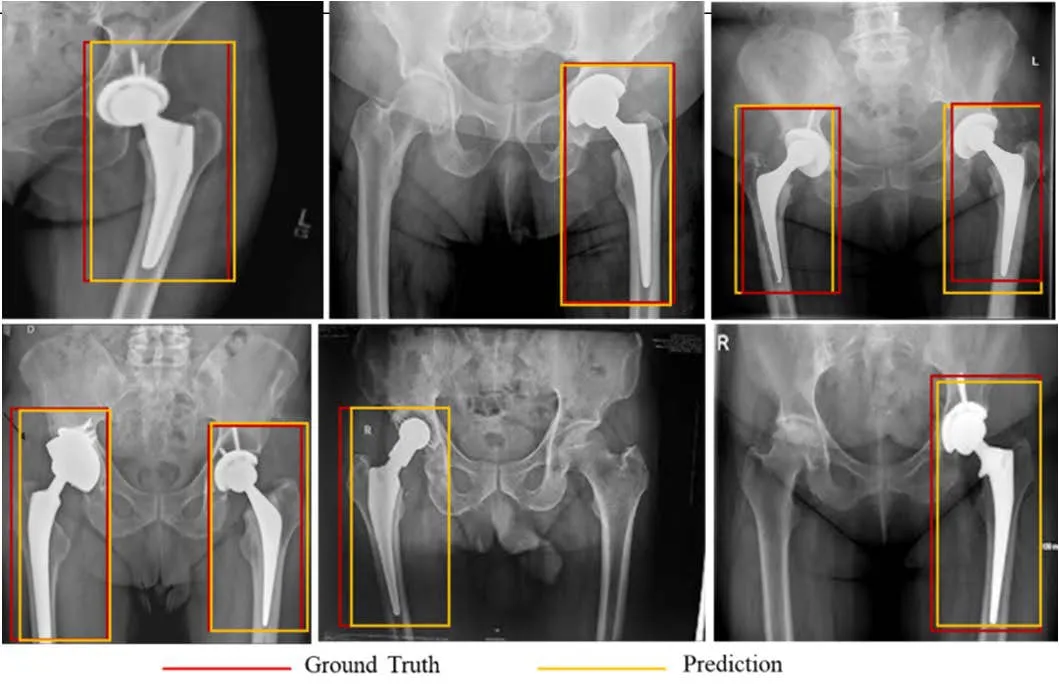
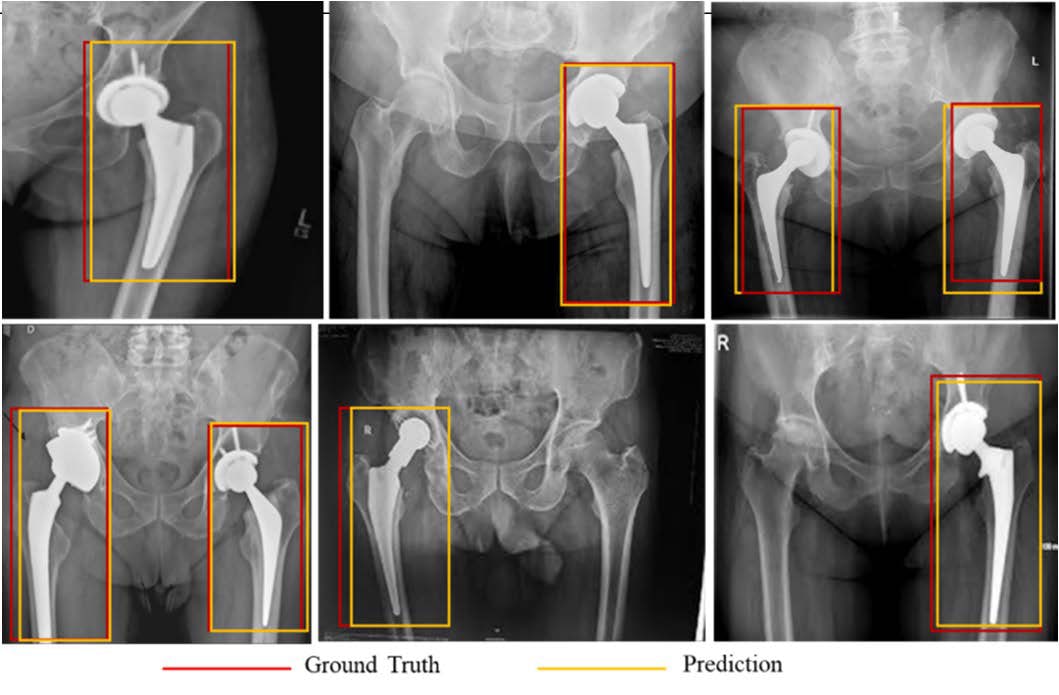
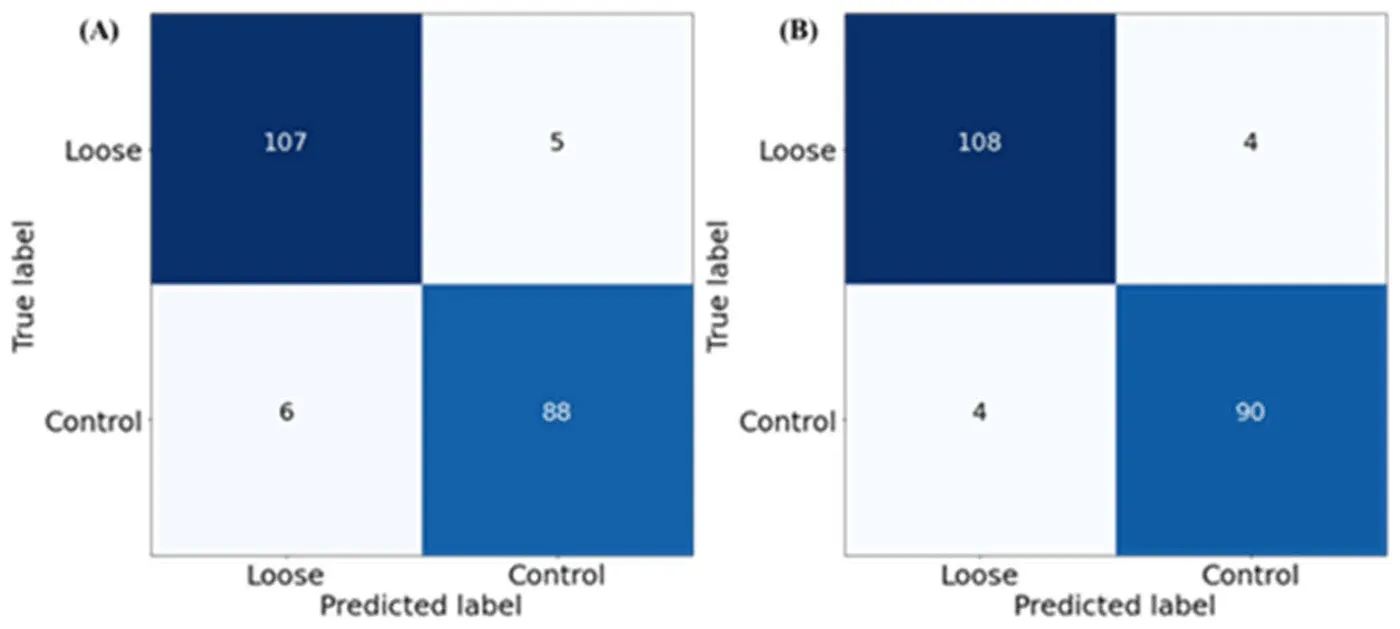
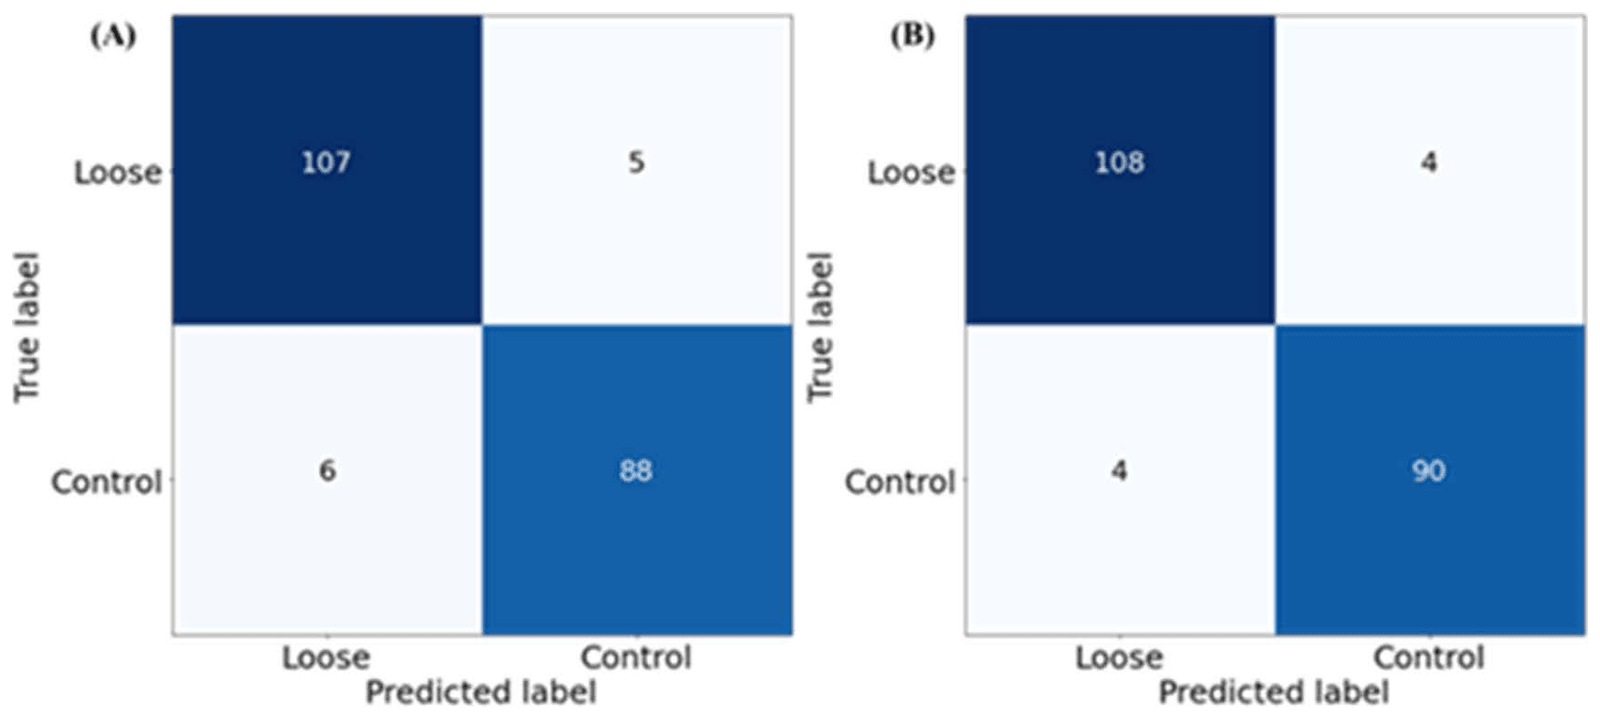
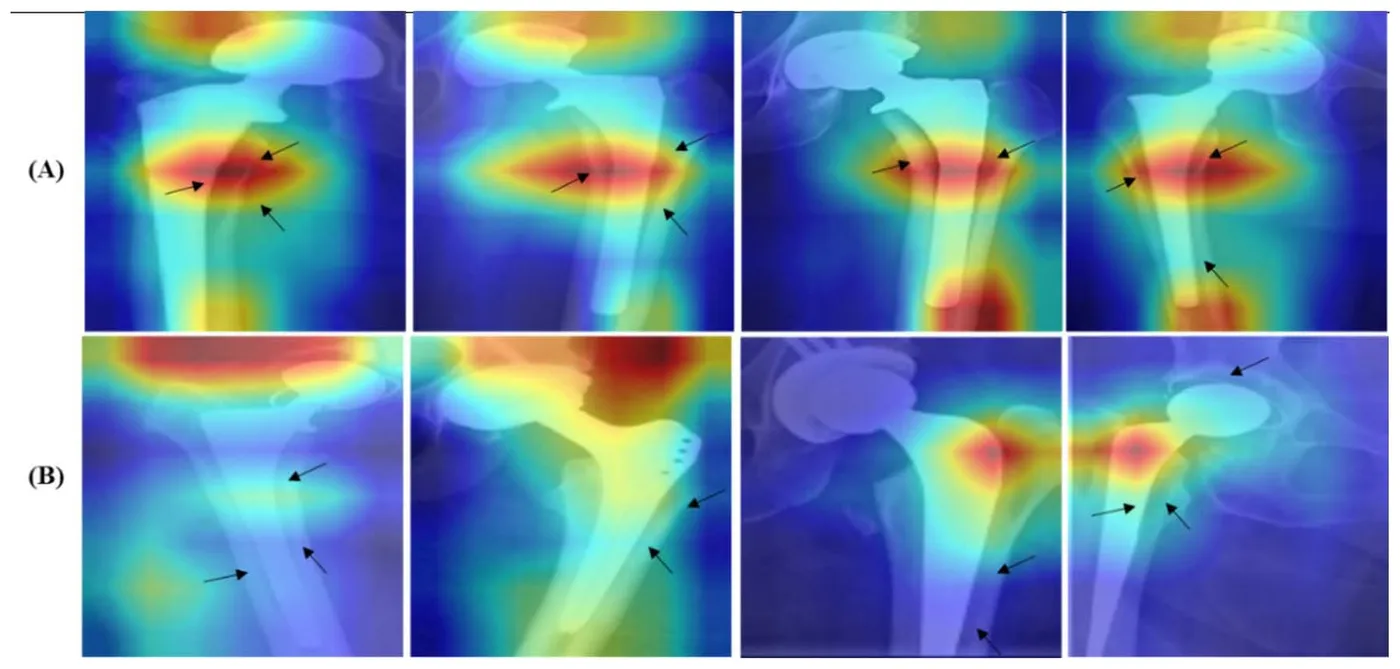
Reading hip radiographs for implant loosening depends on experienced clinicians and can vary between readers. HipXNet first located the implant with YOLOv5, then classified the cropped implant region as loose or control. The study released the Aseptic Loose Hip Implant X-Ray Database, with 200 images for localisation and 206 images for classification, including 112 loose and 94 control cases.
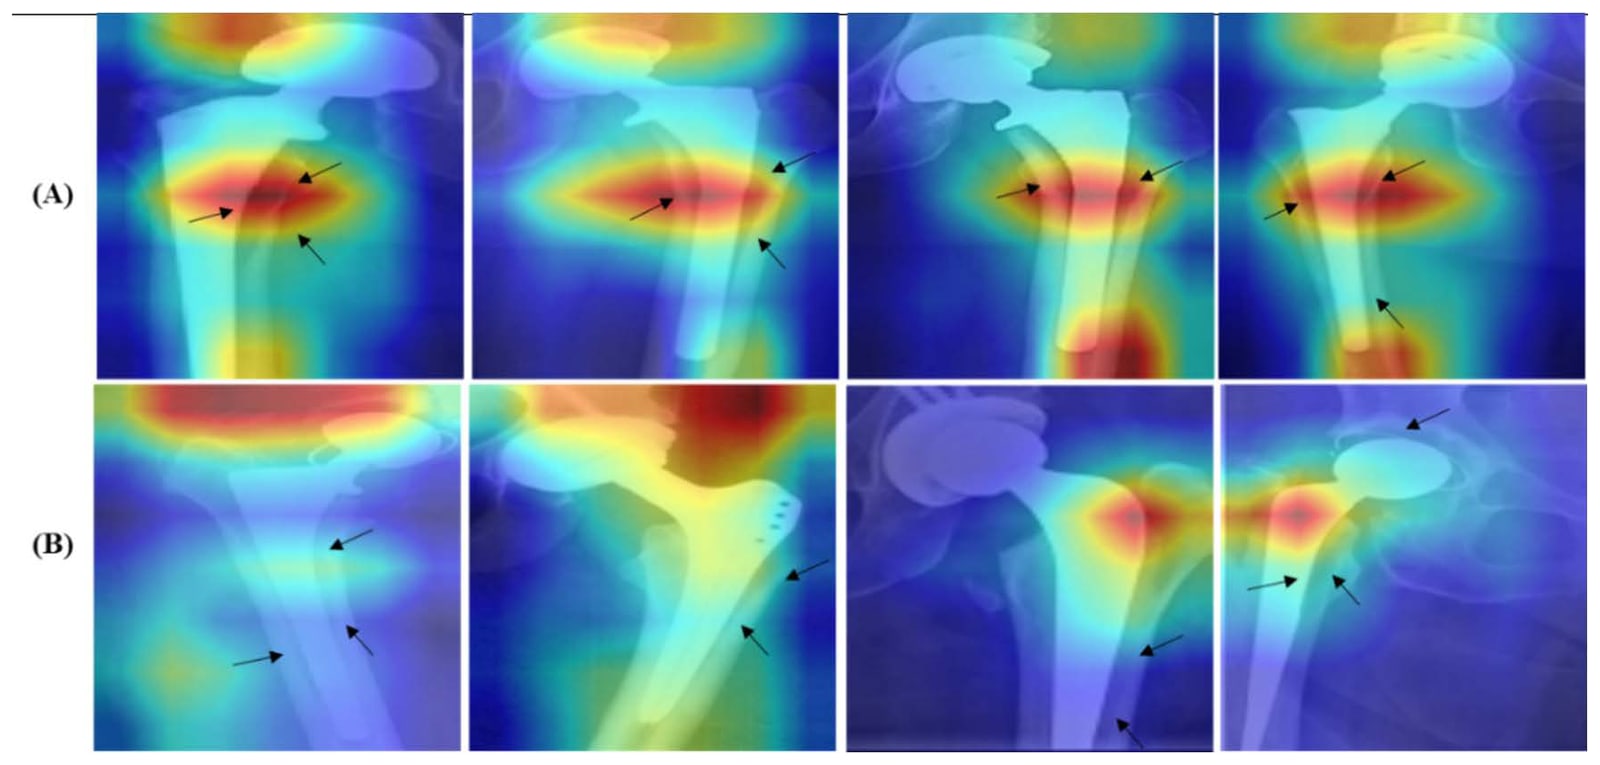
All four YOLOv5 variants reached 100% precision, recall and mAP0.5, and YOLOv5m gave the best mAP0.5–0.95 at 87.8%. DenseNet201 was the best single classifier, while a stacking model with a Random Forest meta-learner raised five-fold accuracy to 96.11%. Score-CAM maps were used to examine the image regions behind each decision.
- Loosening detection accuracy
- 96.11%
- Implant localisation mAP0.5
- 100%
- Loose and control X-rays classified
- 206
| Accuracy | Precision | Sensitivity | F1 score | Specificity | |
|---|---|---|---|---|---|
| ResNet50 | 93.69% | 93.70% | 93.69% | 93.69% | 93.68% |
| DenseNet201 | 94.66% | 94.66% | 94.66% | 94.66% | 94.50% |
| Extra Trees stacking | 95.55% | 95.56% | 95.55% | 95.55% | 95.60% |
| Random Forest stacking | 96.11% | 96.42% | 96.42% | 96.42% | 96.74% |
Reviewing implant biomaterials and performance measures
Polymers · 2022
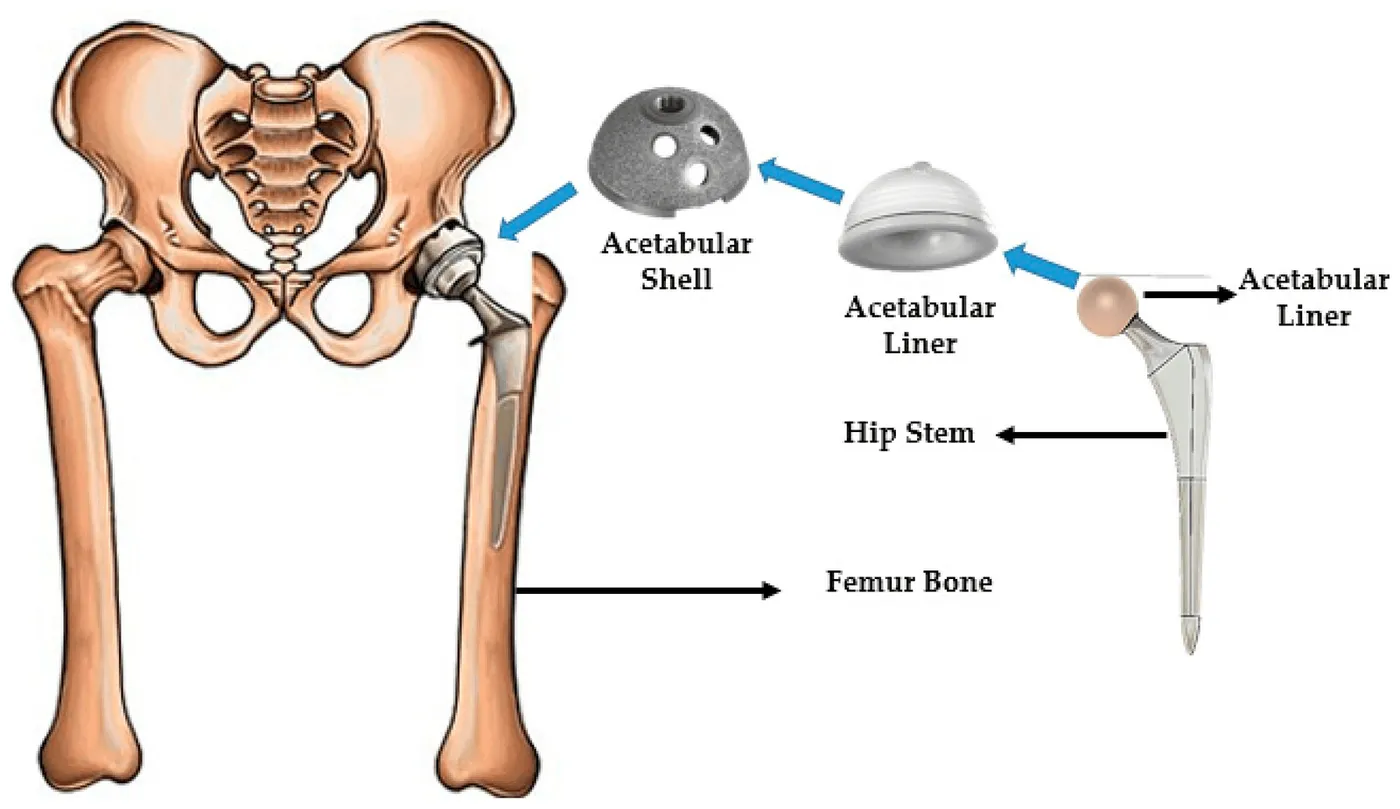
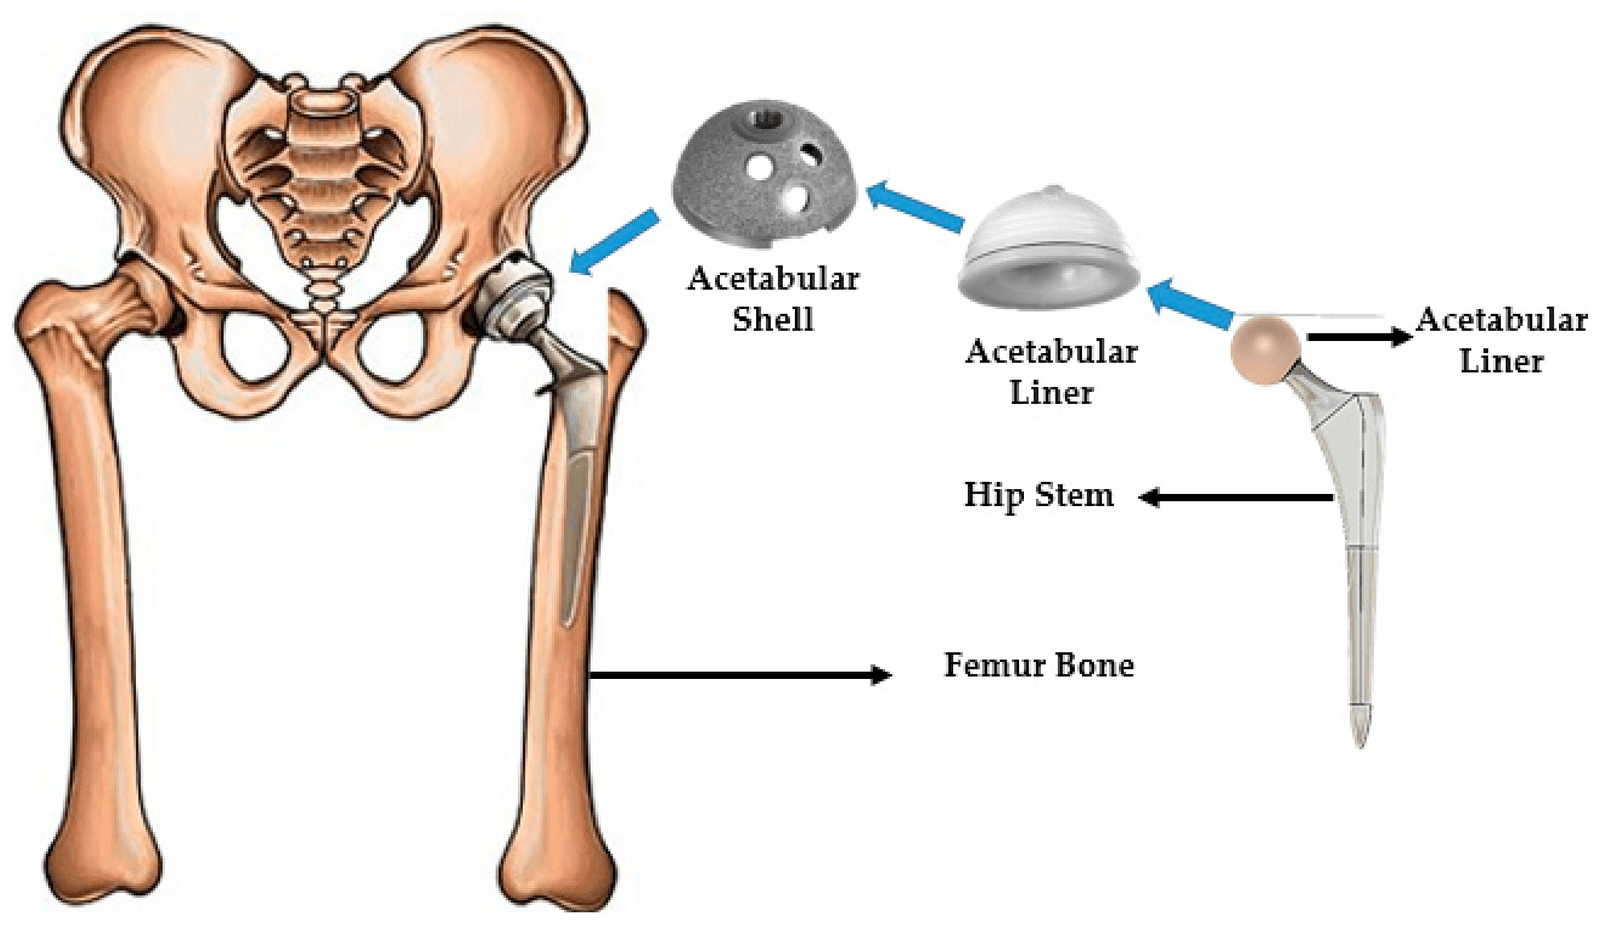
This review connected biomaterial choice with common causes of implant failure, including stress shielding, dislocation, aseptic loosening, reduced bone remodelling and tissue reactions to wear debris. It brought together pre-clinical finite element analysis with in vitro, in vivo and clinical evidence.
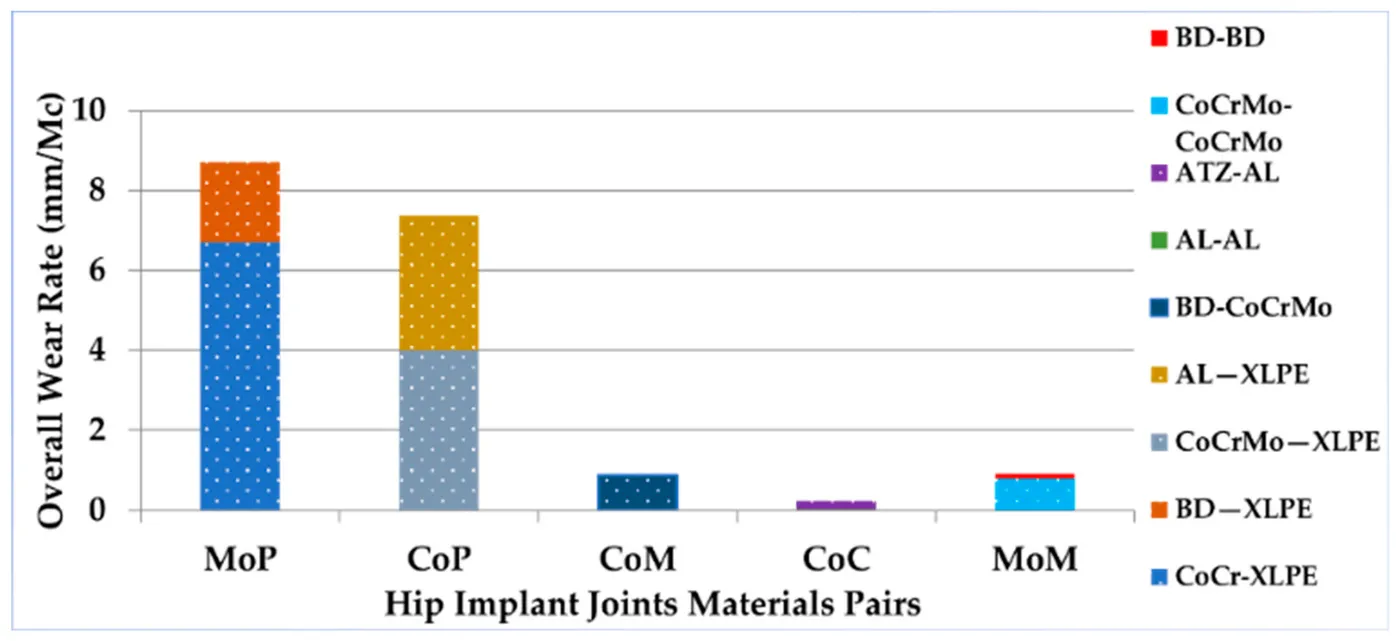
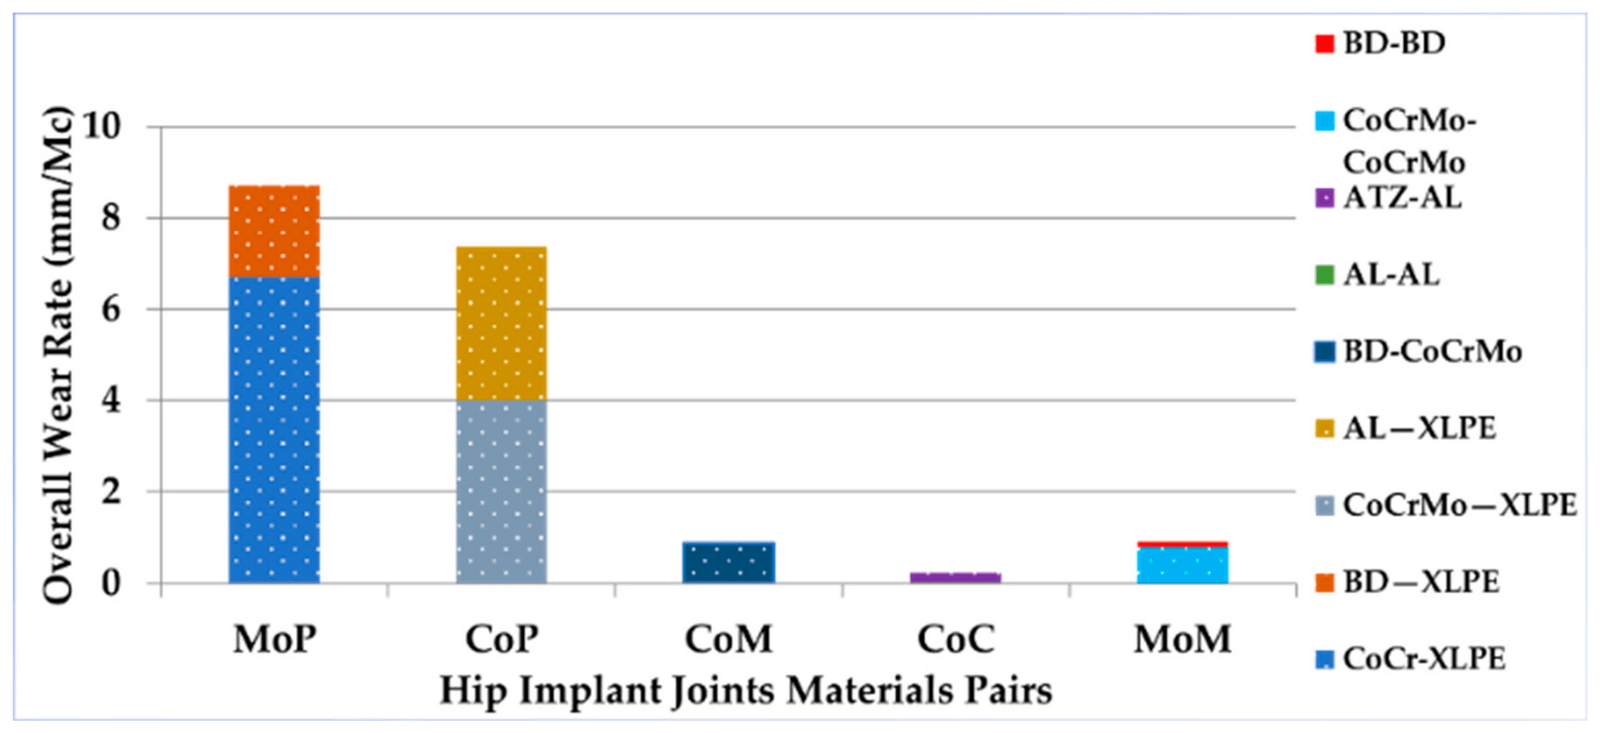
The finite element evidence was organised around four mechanical measures: von Mises stress and deformation, micromotion, wear and fatigue. Across the joint material pairs compared, ceramic-on-ceramic bearings had the lowest overall wear rate.
- Mechanical performance areas
- 4
- Reported period when most implants fail
- 10–15 years
- Lowest overall wear among compared pairs
- Ceramic-on-ceramic
| What it helps assess | |
|---|---|
| Von Mises stress and deformation | Load transfer and structural response |
| Micromotion | Stability at the bone–implant contact |
| Wear | Debris generation at joint surfaces |
| Fatigue | Failure risk under repeated loading |
Testing surface acoustic wave sensing on an implant
Biosensors · 2023
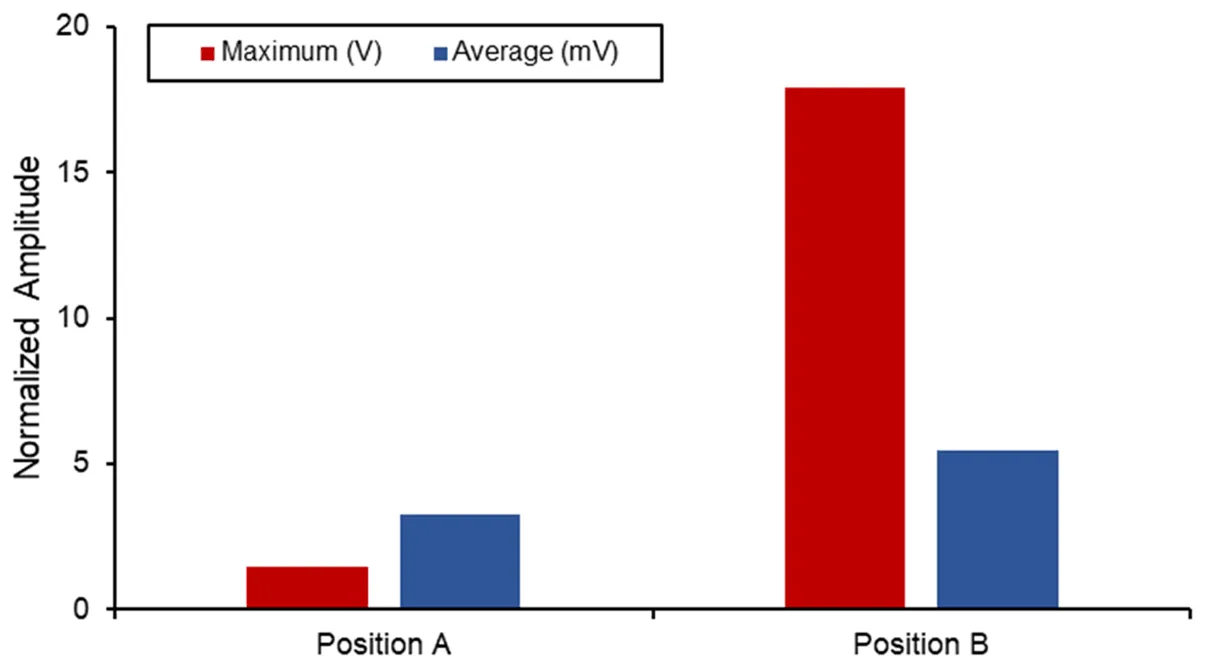
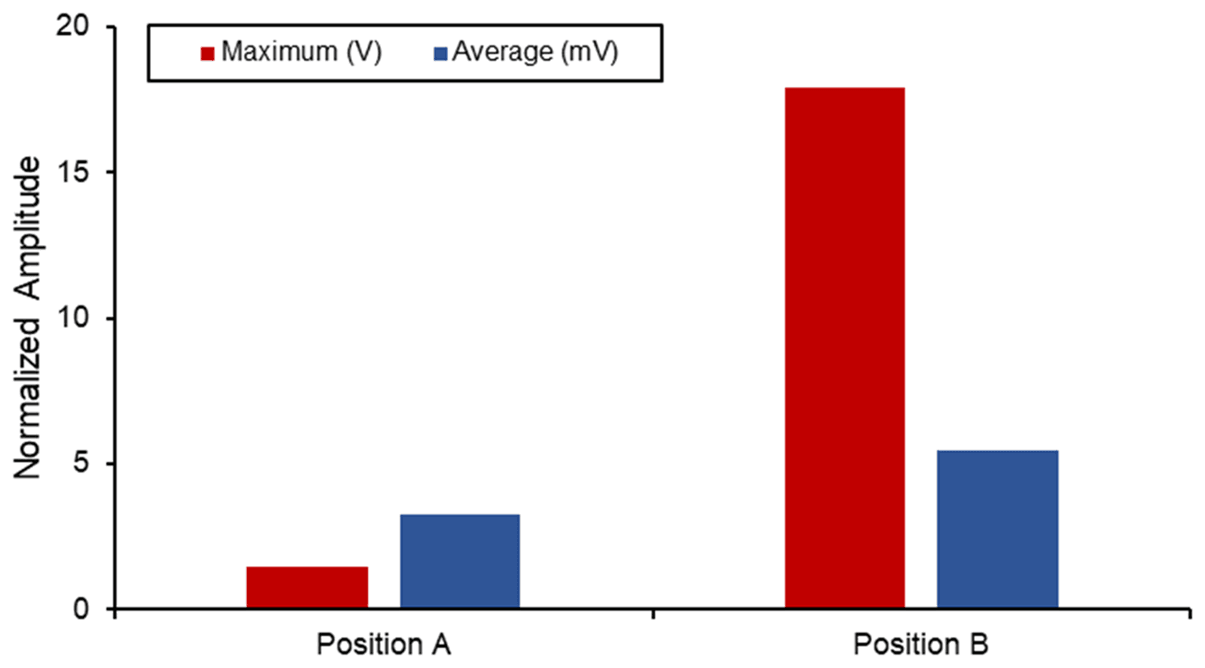
This simulation study examined whether a two-port surface acoustic wave sensor could support implant-loosening monitoring. The lithium niobate device was designed for 872 MHz and analysed in COMSOL, with a maximum insertion loss of −8.79 dB at 864 MHz.
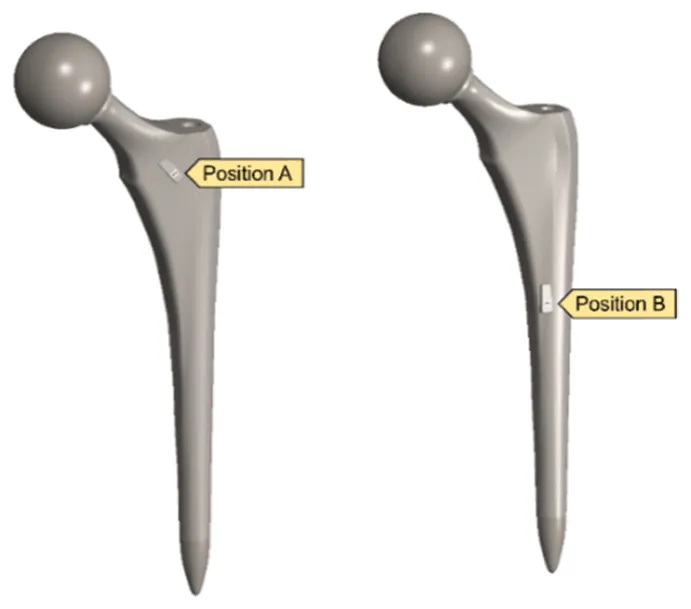
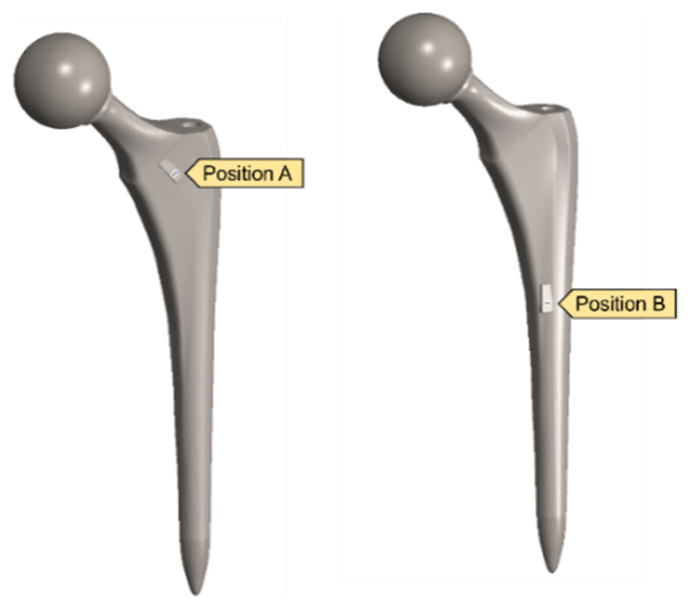
The sensor was then placed at two positions on a hip implant and studied under three upper- and lower-body loading conditions. Stresses stayed below yield limits, and Position B produced the higher maximum voltage. The authors identified dynamic loading and vibro-acoustic behaviour as the next steps for long-term monitoring.
- Sensor operating frequency
- 872 MHz
- Maximum simulated voltage
- 17.88 V
- Sensor positions on the implant
- 2
| Substrate | Young’s modulus | Maximum voltage | |
|---|---|---|---|
| This study | LiNbO₃ | 70 GPa | 17.88 V |
| Lange and Kluess (2021) | PZT ceramic | 52.4 GPa | 7.64 V |
| Lange et al. (2020) | PZT ceramic | 52.4 GPa | 2.88 V |
Designing a spiral head–stem trunnion
Materials · 2023
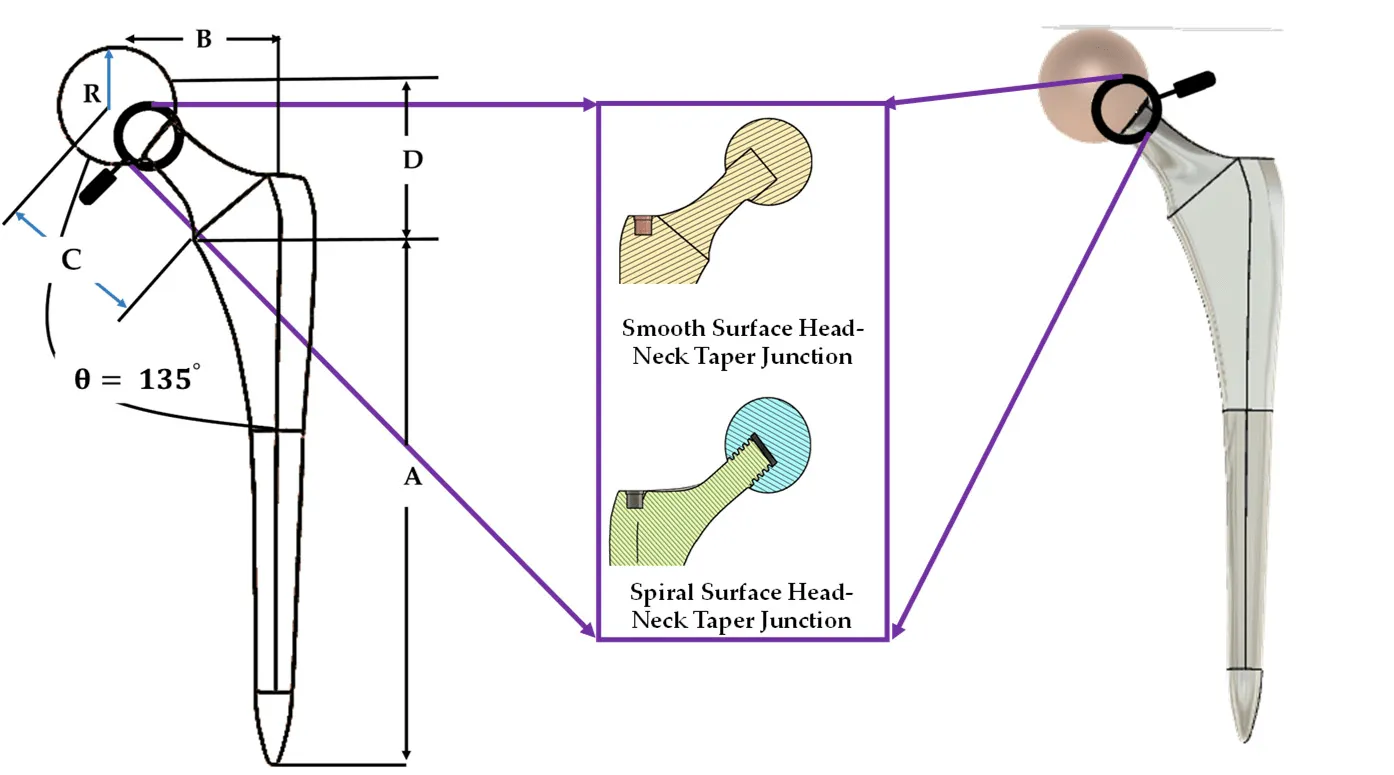
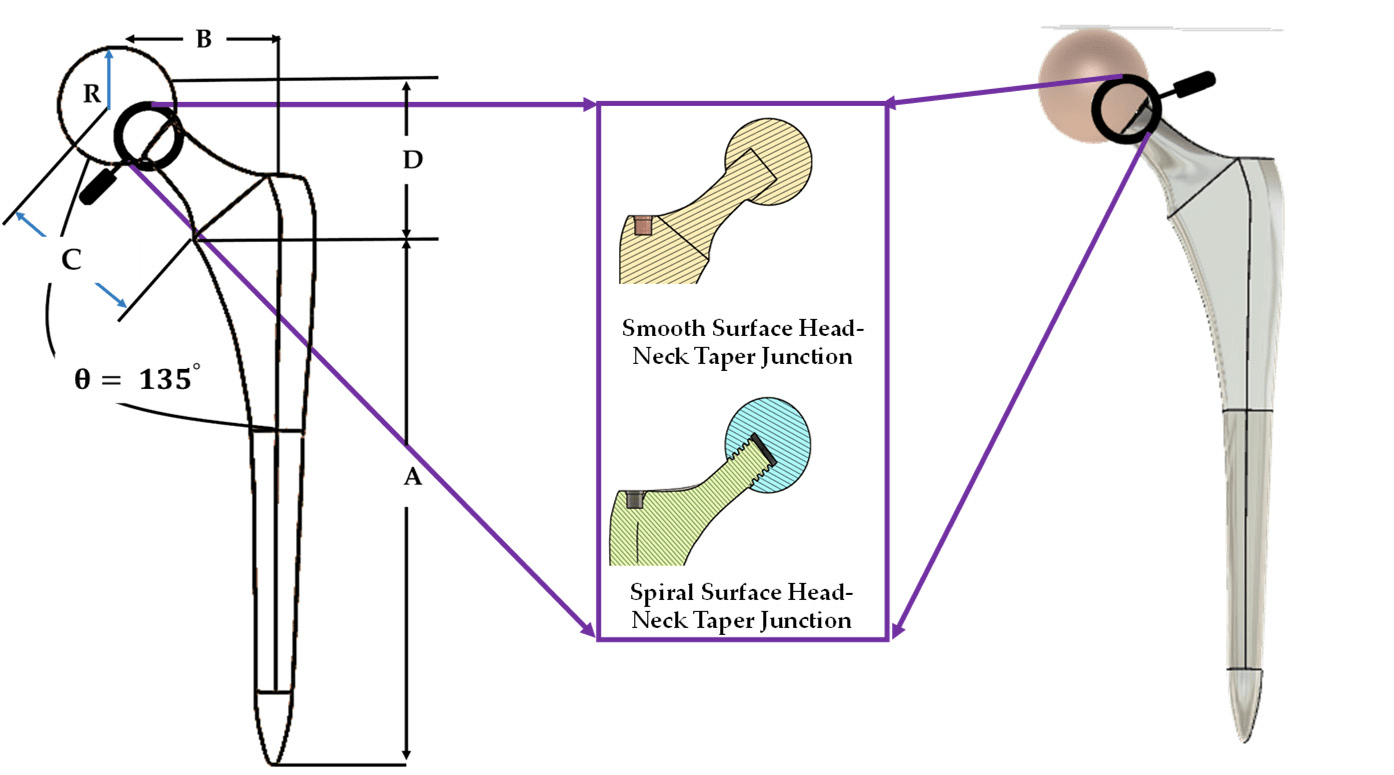
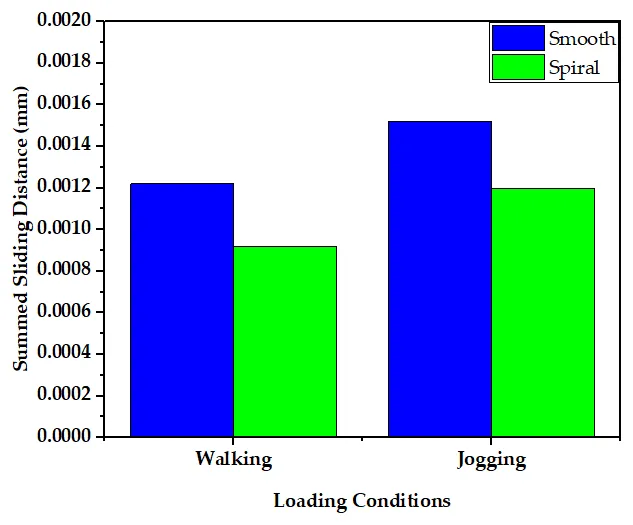
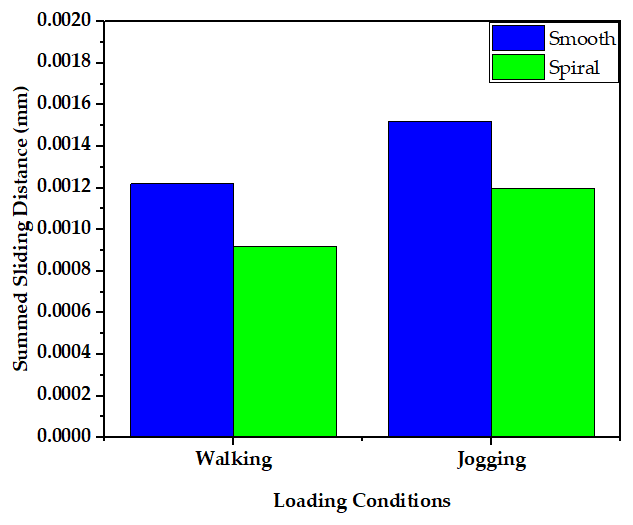
Fretting wear at the head–stem junction can contribute to hip implant failure. This study introduced a spiral trunnion and compared it with a smooth design using finite element analysis under walking and jogging loads. Wear was estimated with the Archard model.
Average contact pressure was nearly the same for both designs, while the spiral design gave more uniform contact and shorter sliding distances. These changes supported stronger fixation and lower predicted wear.
- Predicted spiral wear per million cycles
- 0.039 mm³
- Lower predicted wear than the smooth trunnion
- ≈10%
- Shorter summed sliding distance
- ≈10%
| Smooth trunnion | Spiral trunnion | |
|---|---|---|
| Predicted wear | 0.048 mm³ per million cycles | 0.039 mm³ per million cycles |
| Summed sliding distance | Reference | About 10% shorter |
| Average contact pressure | Nearly the same | Nearly the same |
| Fixation | Reference | Stronger |
Mapping new stem and joint designs
Journal of Materials Chemistry B · 2023
This review examined how implant geometry affects stress distribution, micromotion, wear, dislocation and stability. It covered porous and functionally graded stems, femoral resurfacing, short and collared stems, and newer joint geometries.
From the research gaps, the authors proposed two design directions: a collared stem with a porous functionally graded structure, and a spiral or gear-shaped tapered joint to reduce wear and improve stability.
- Implants reported to need revision within 1–10 years
- 10–20%
- Design directions proposed
- 2
| Main aim or finding | |
|---|---|
| Porous lattice and graded stems | More uniform stress transfer while preserving strength and bone growth |
| Resurfacing, short and collared stems | Better load transfer, with mechanical stability still a challenge |
| Dual-mobility and reverse joints | Reduced dislocation limits |
| Unidirectional femoral head–liner joints | Lower wear than traditional ball-and-socket joints |
Comparing stem materials in the implanted femur
Materials Today Communications · 2024
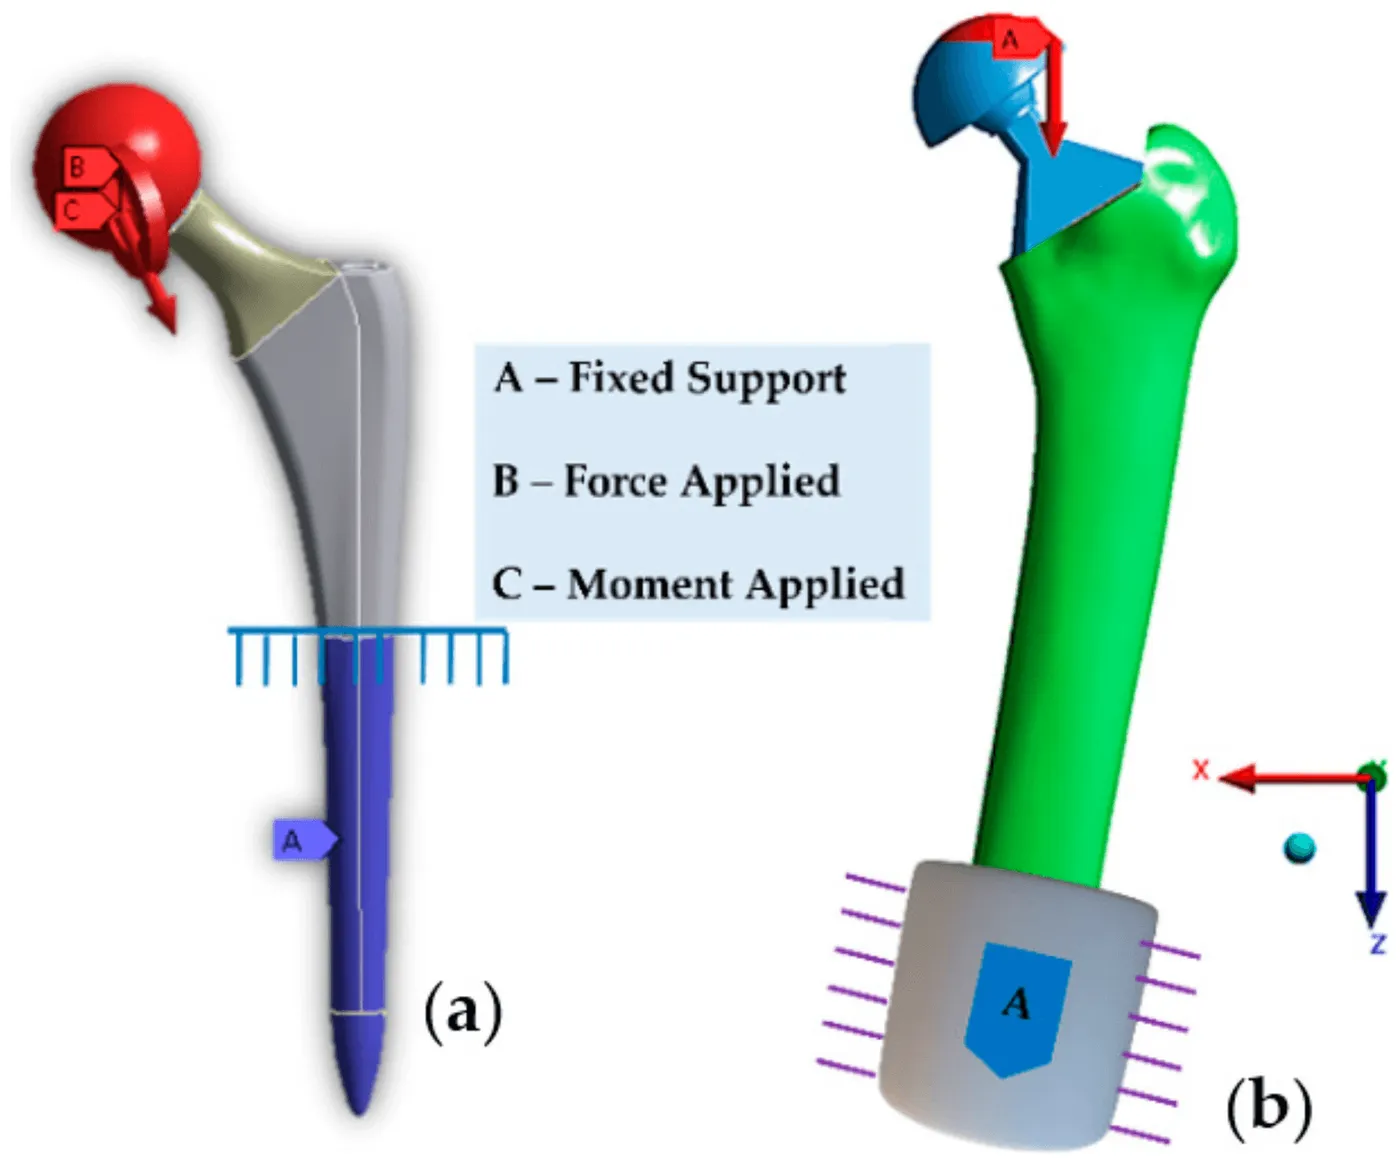
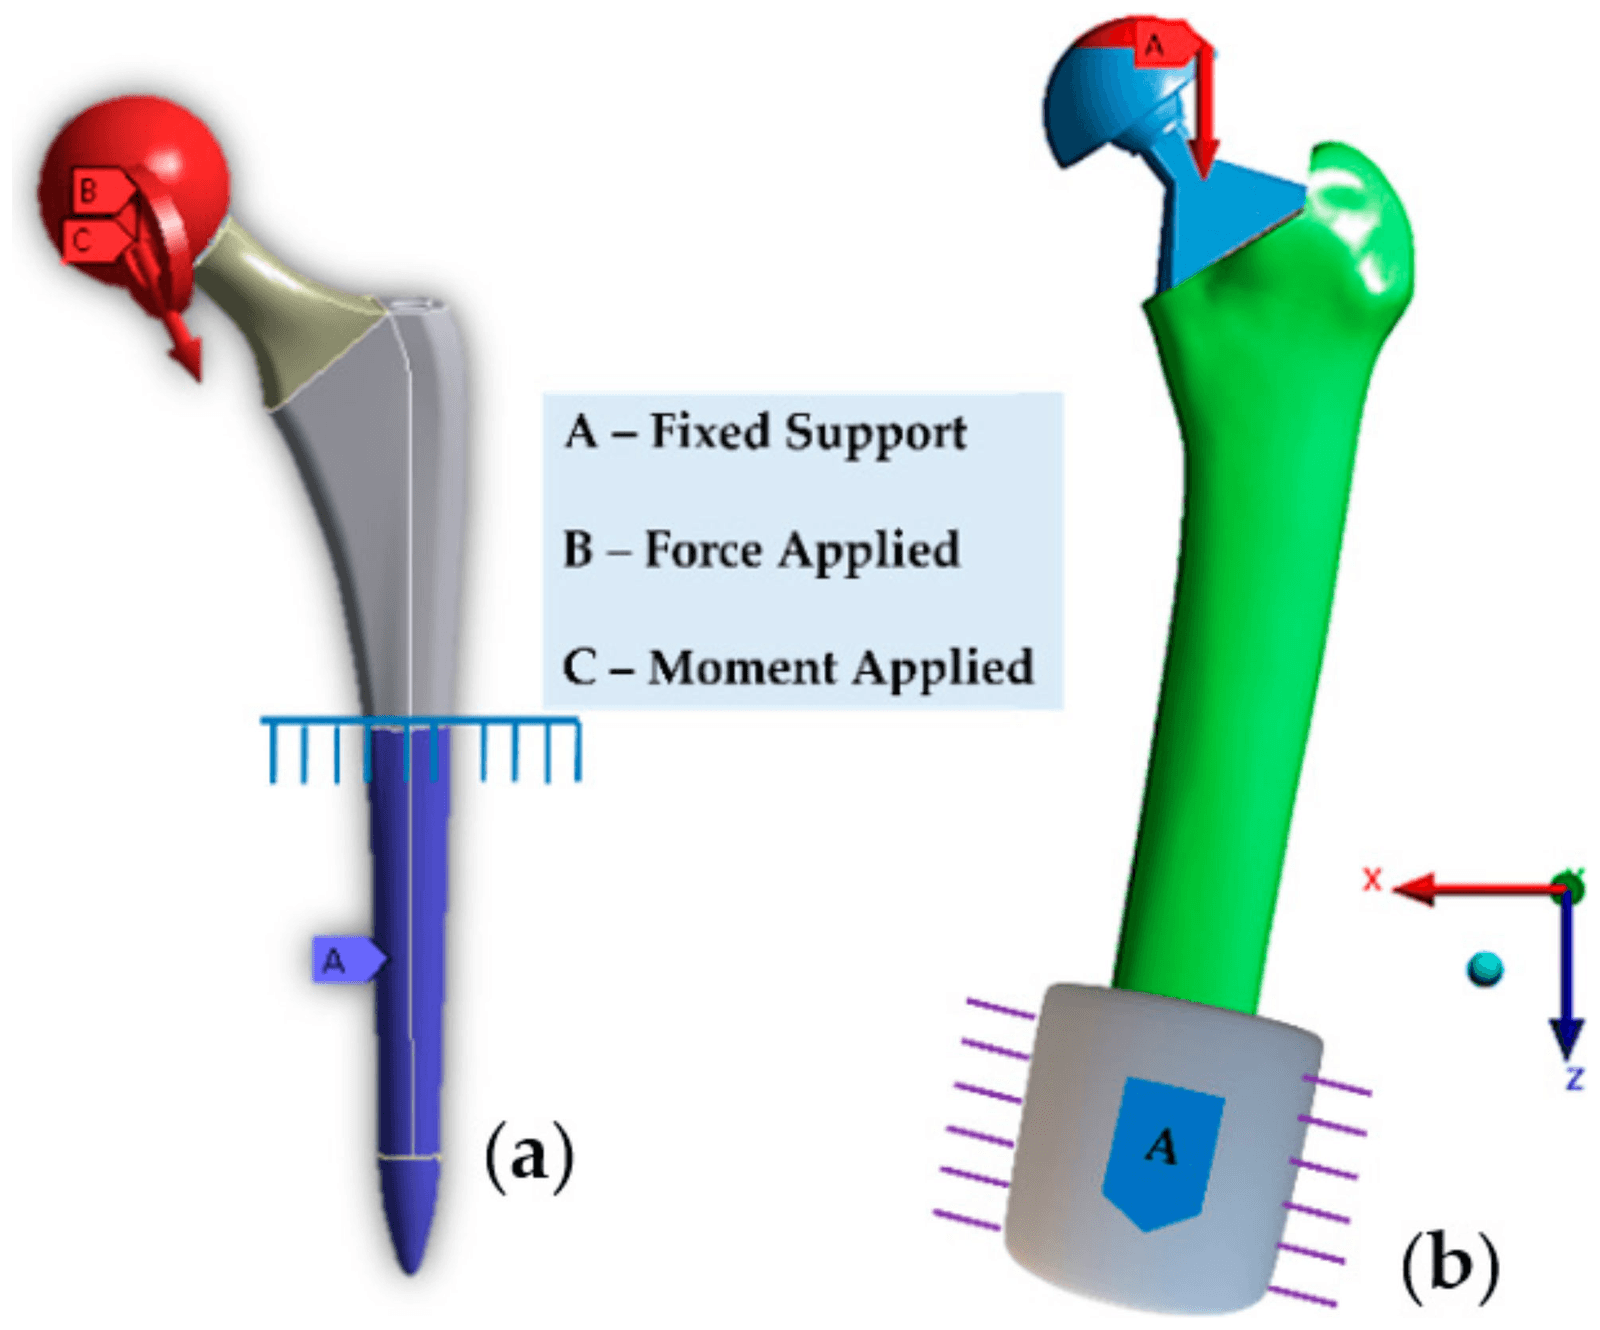
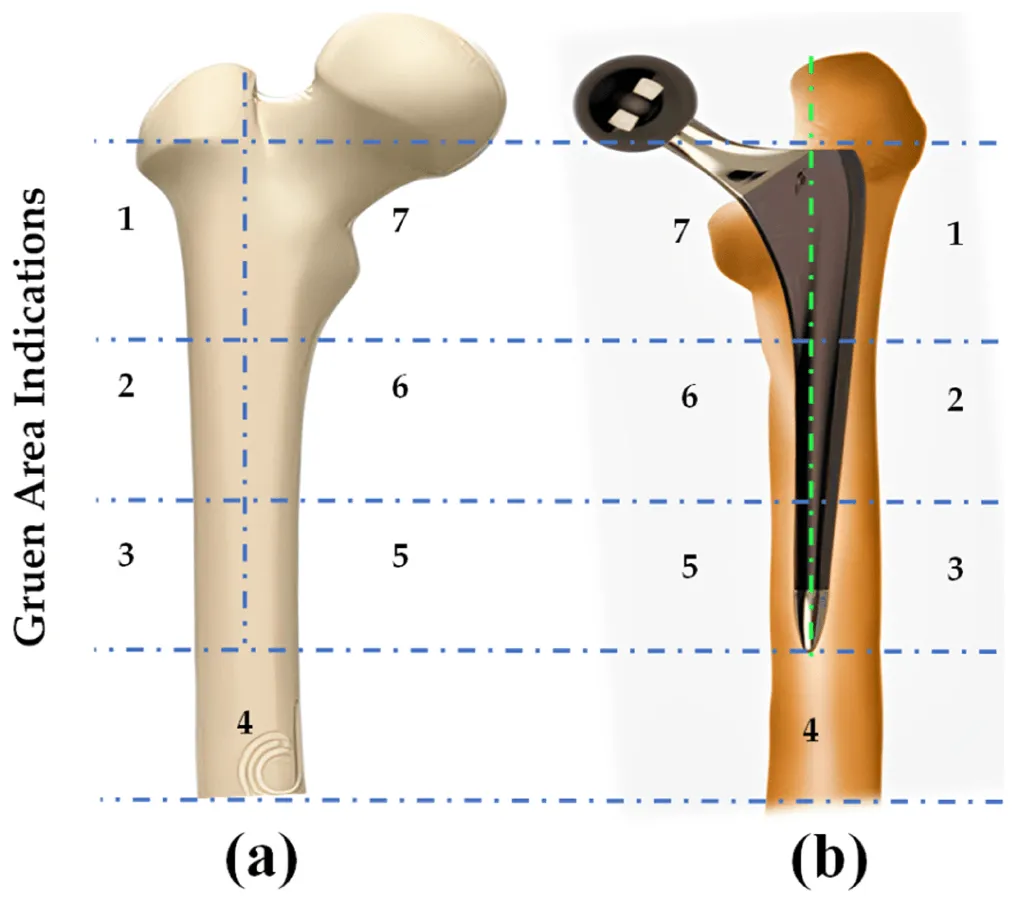
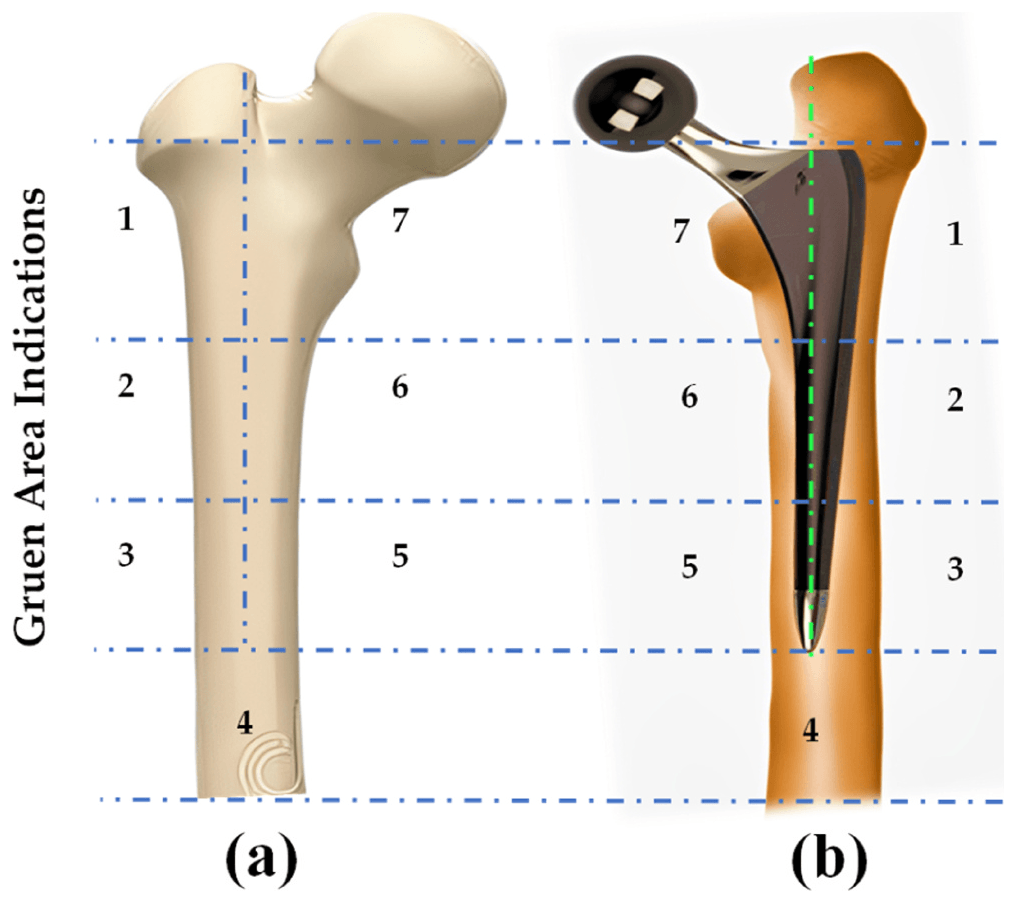
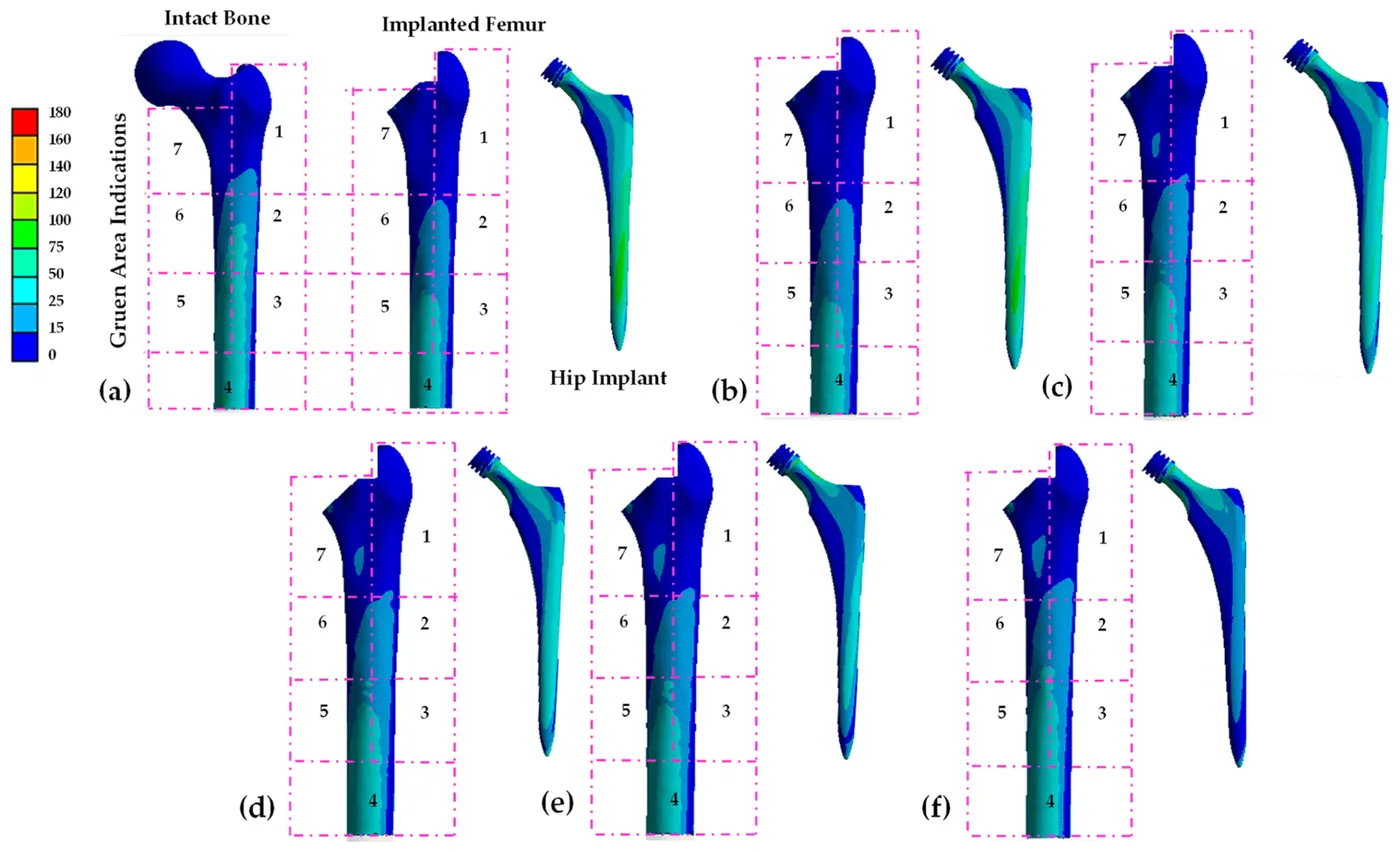
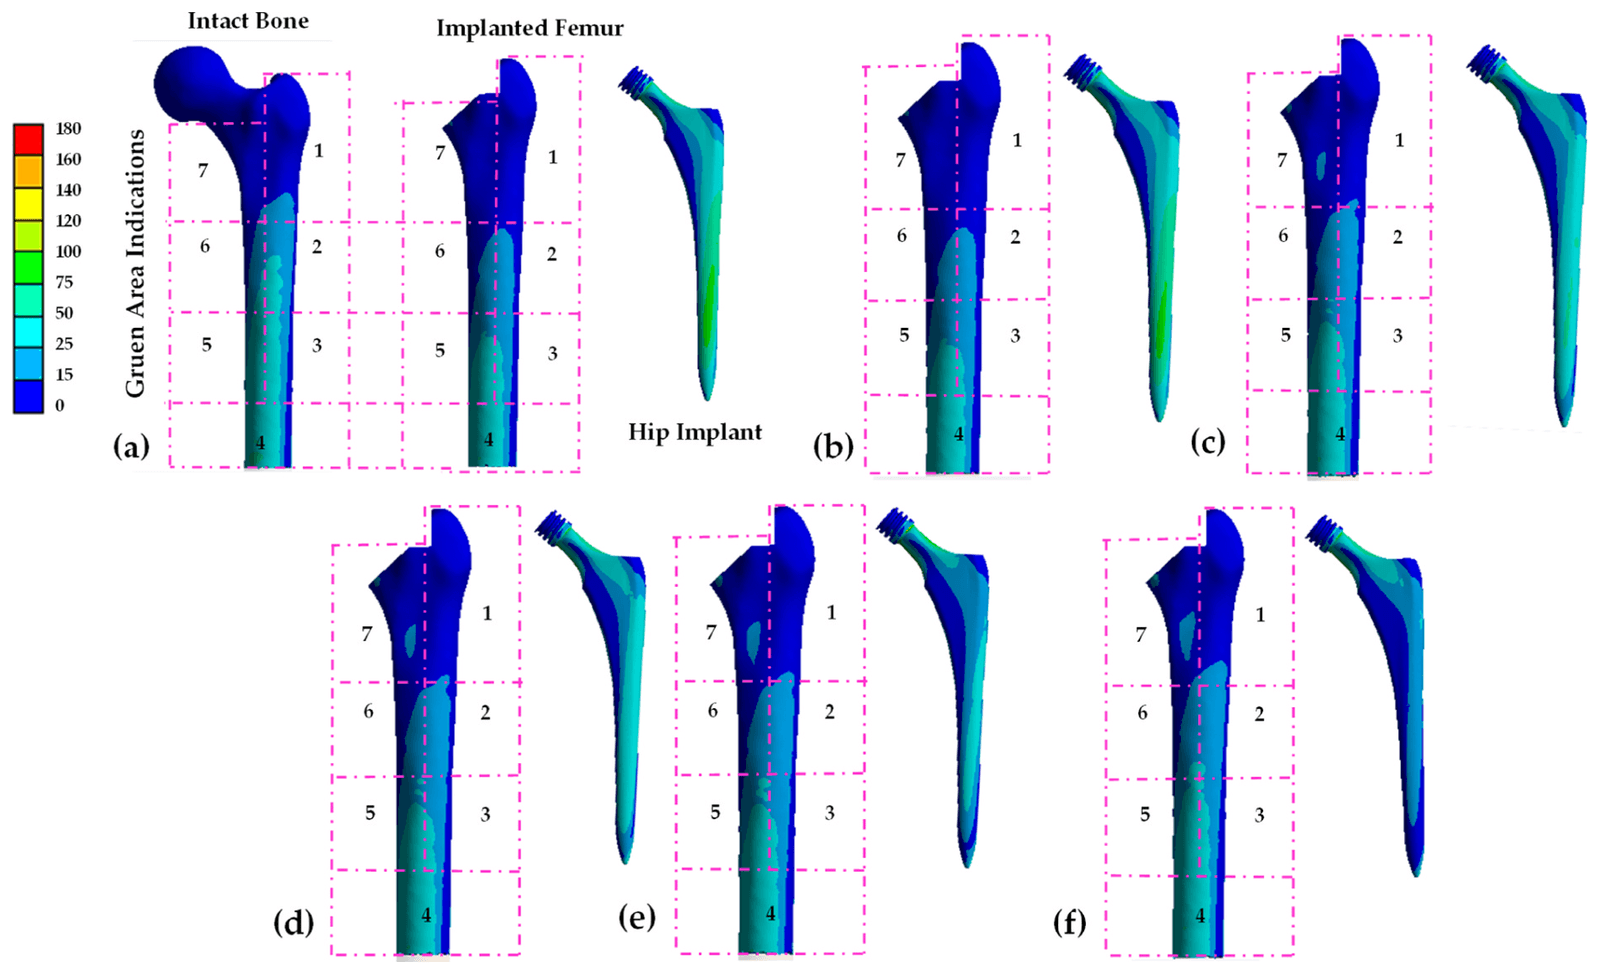
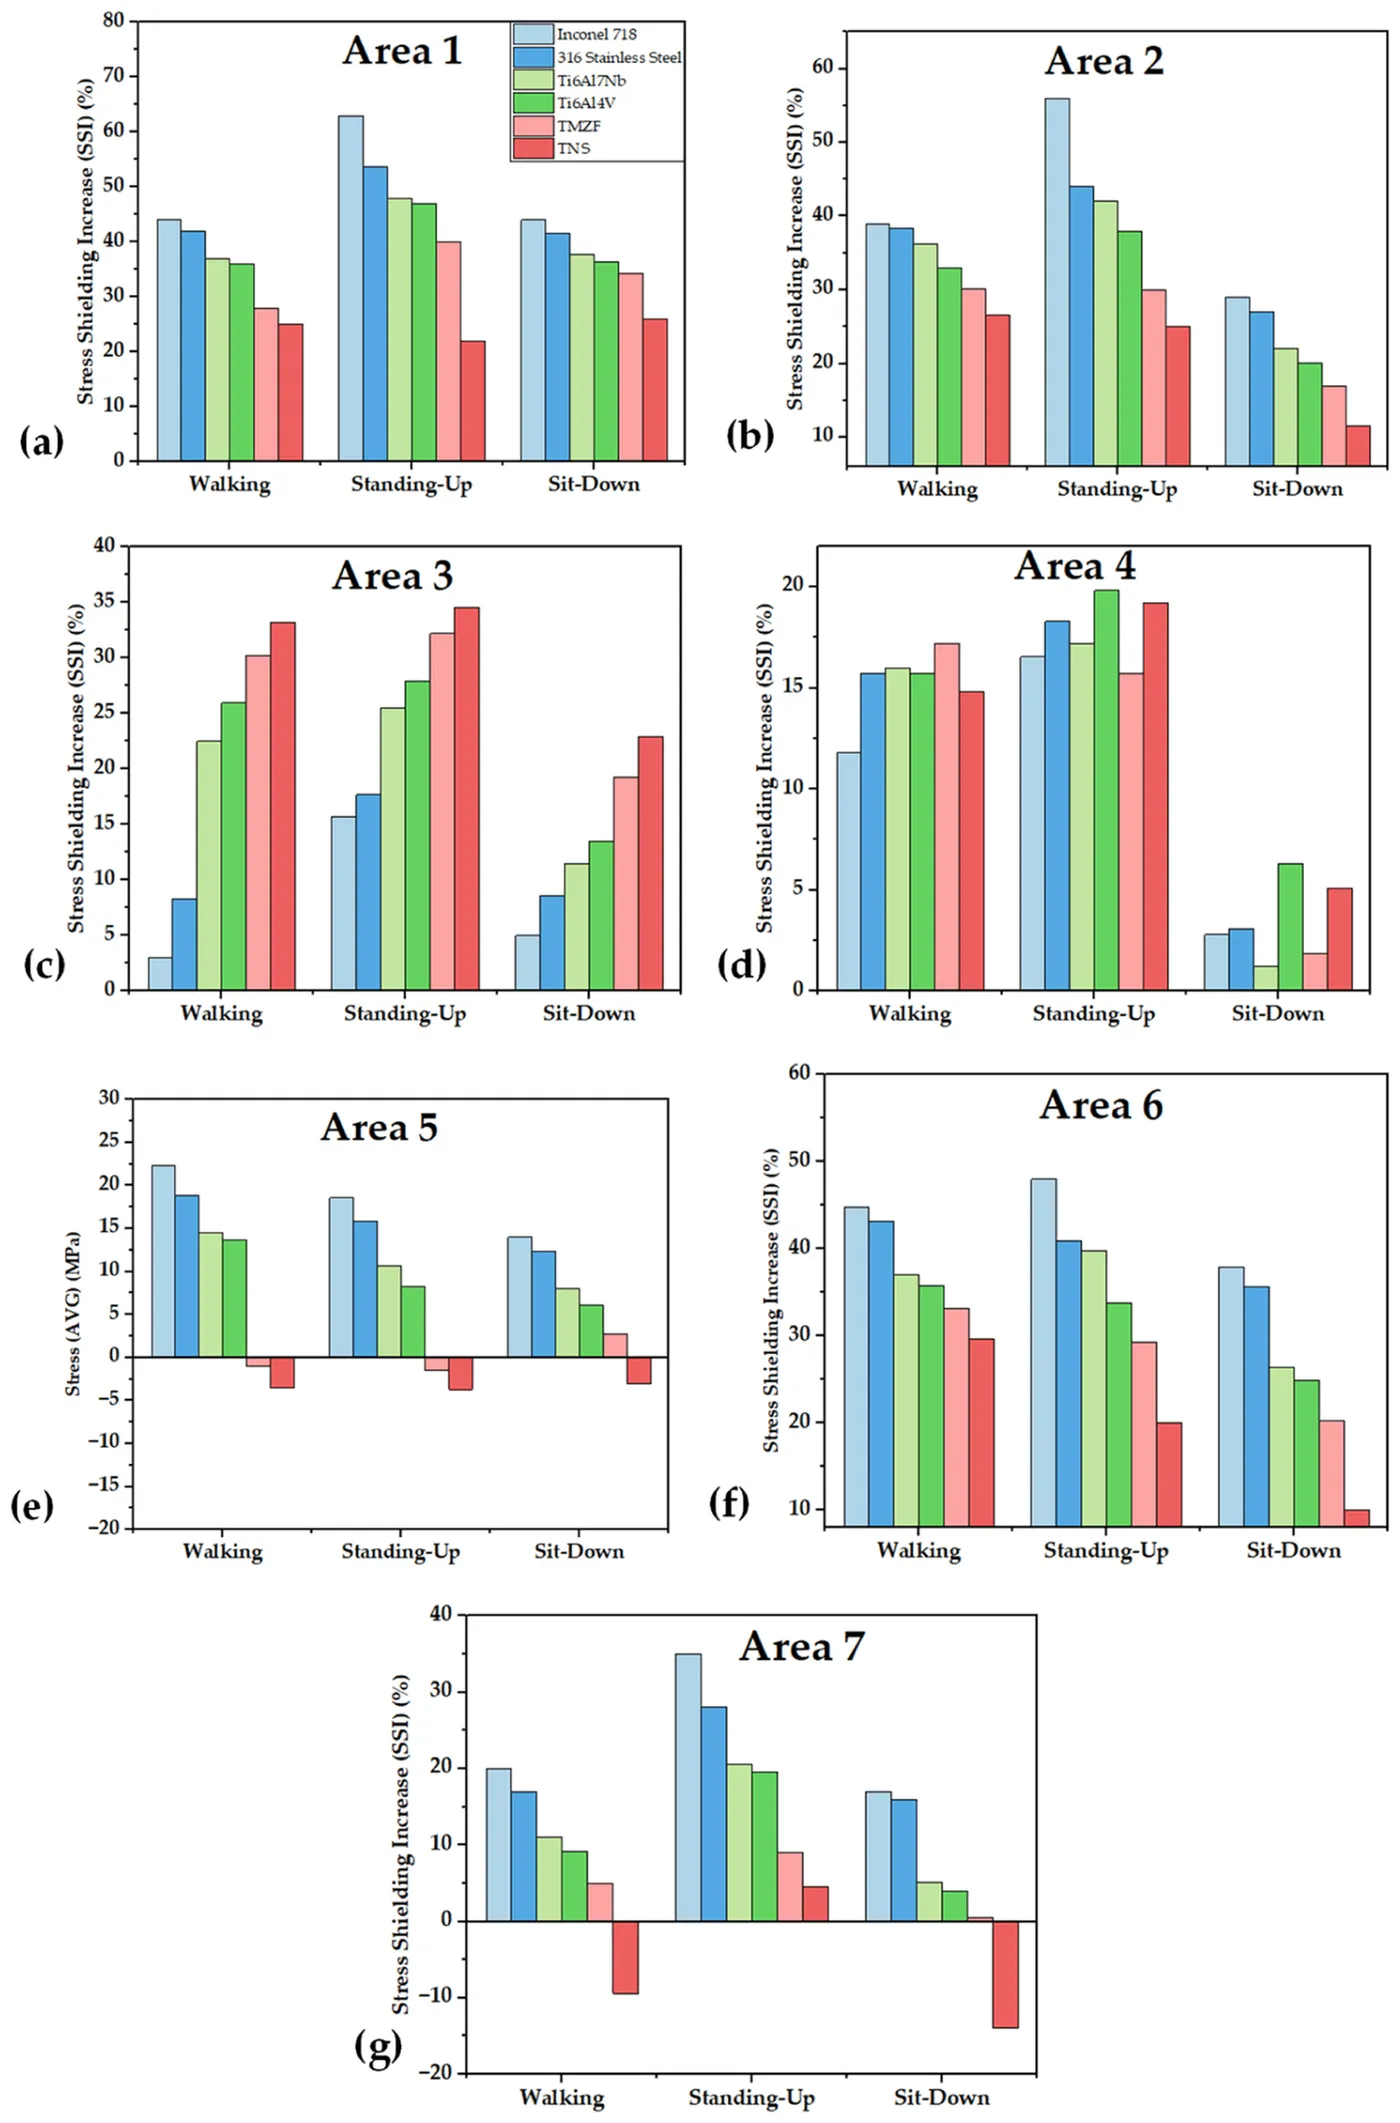
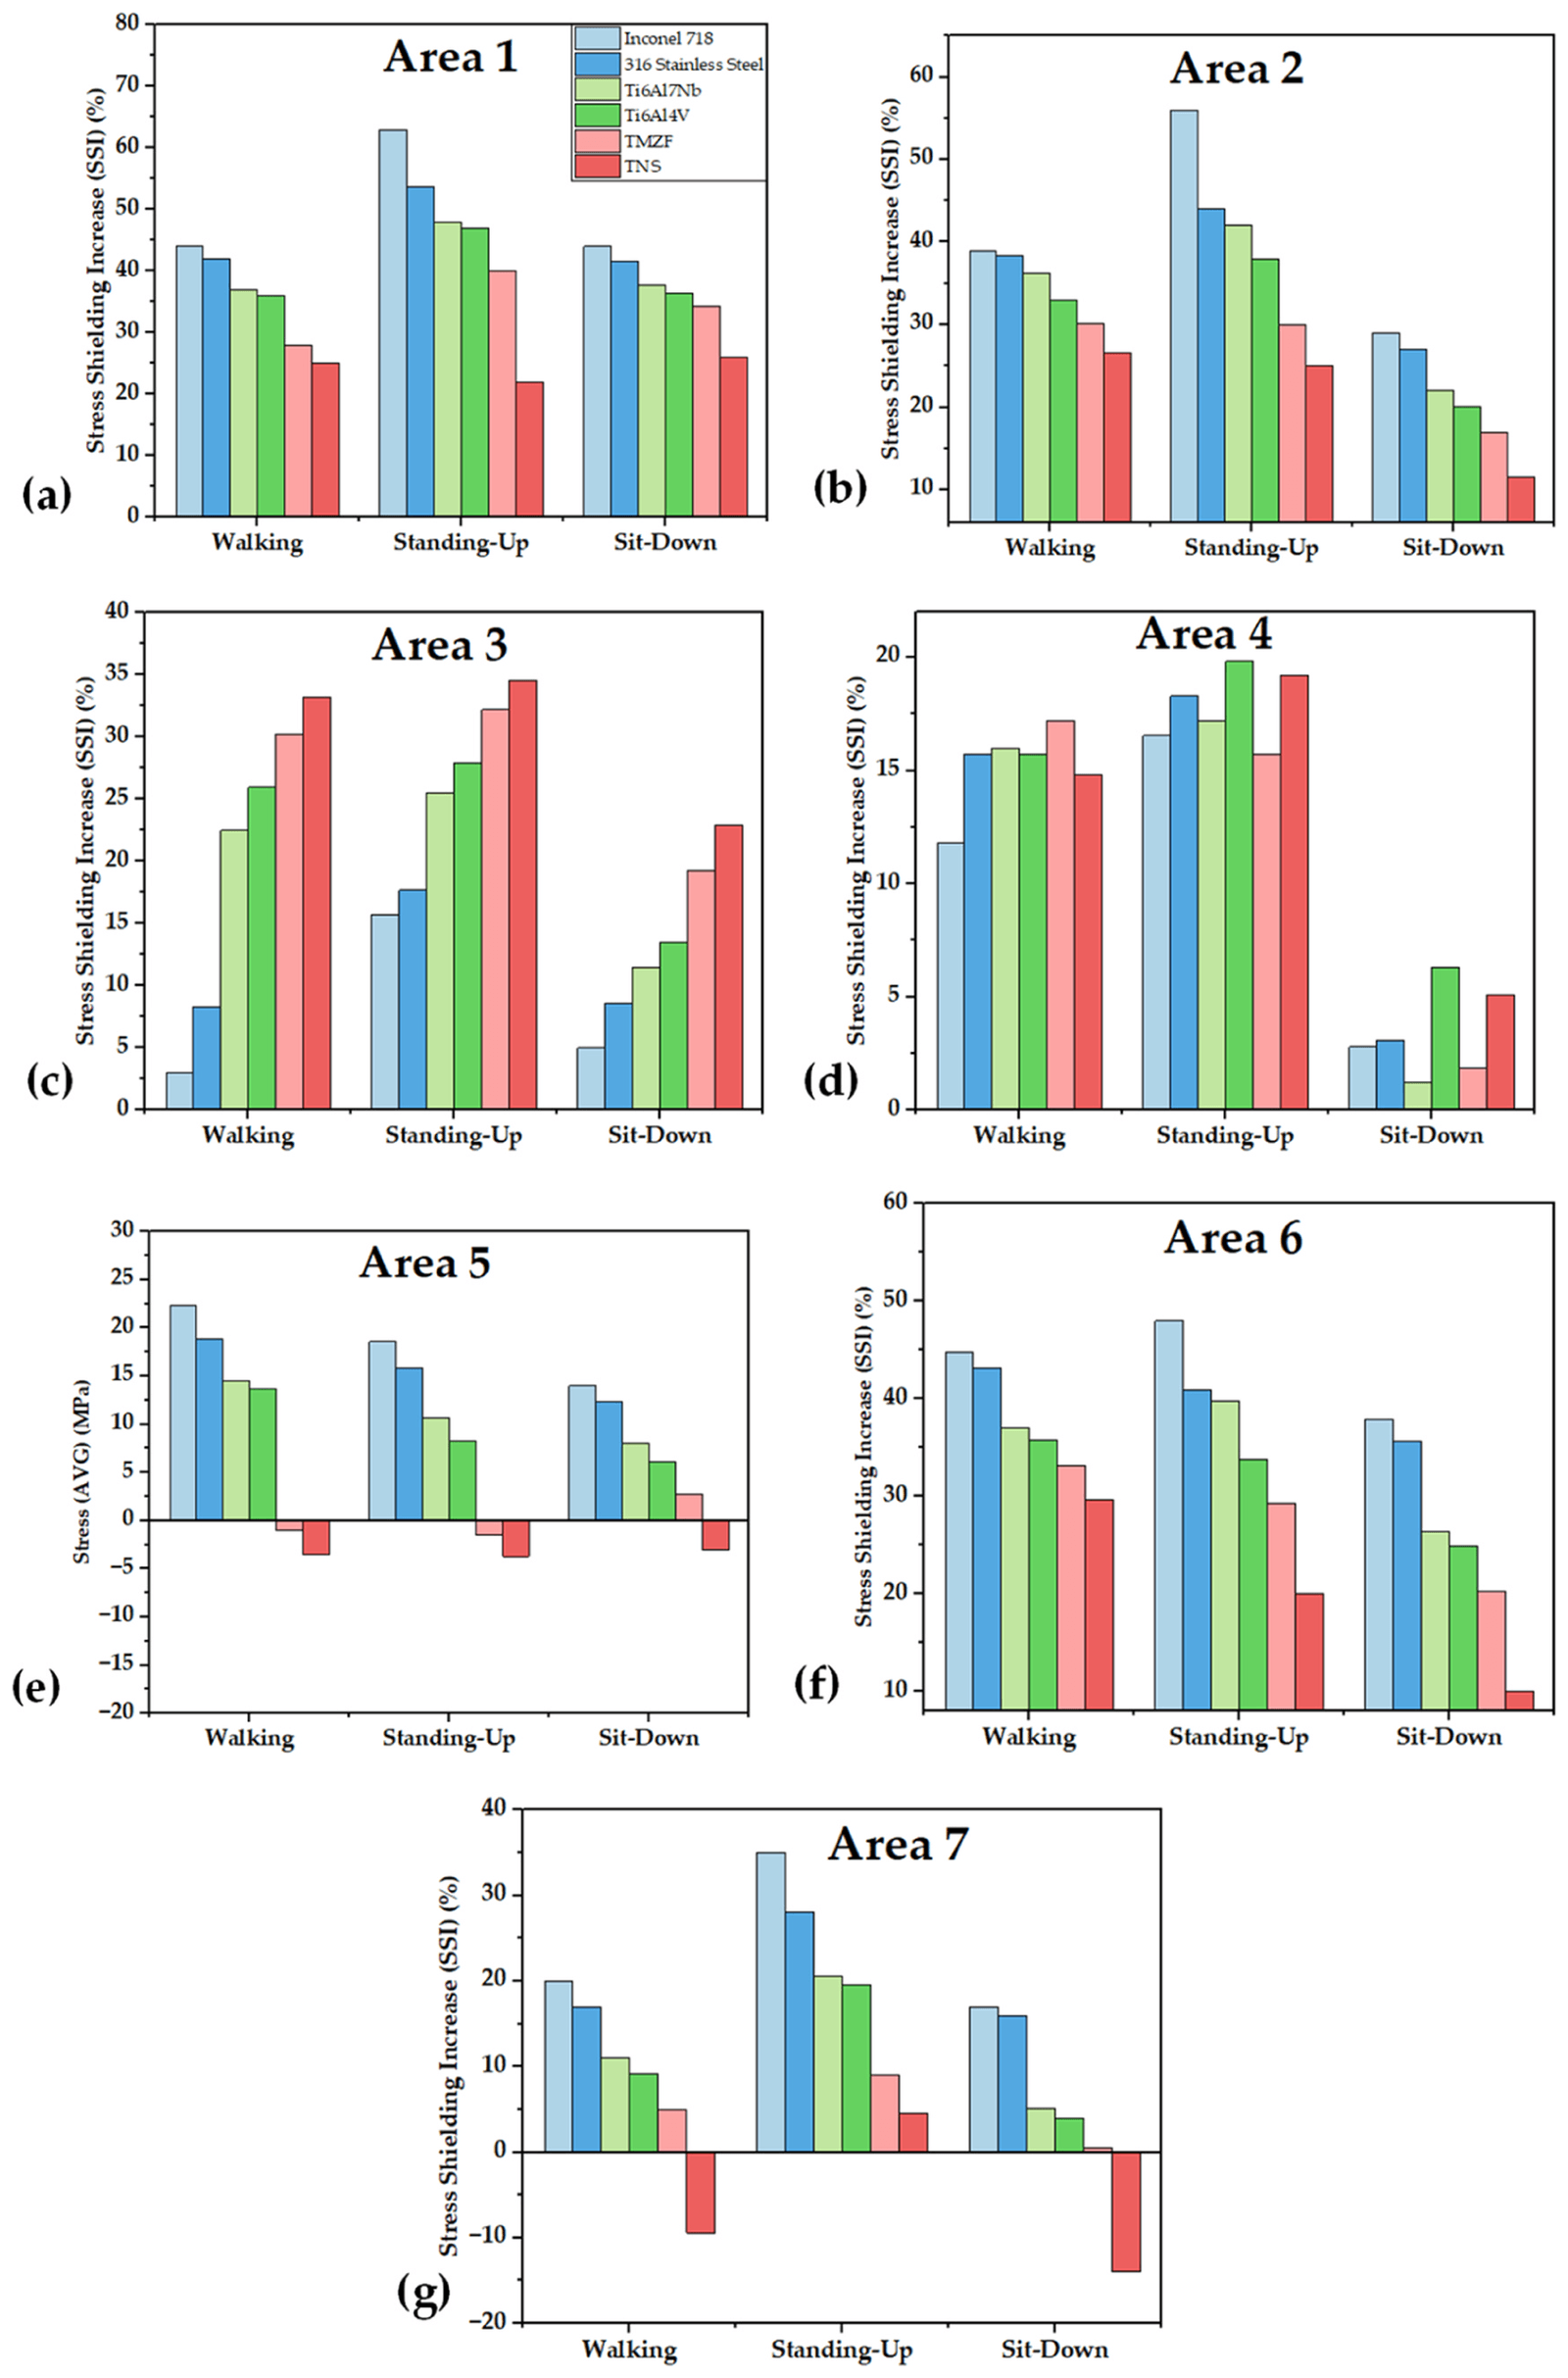
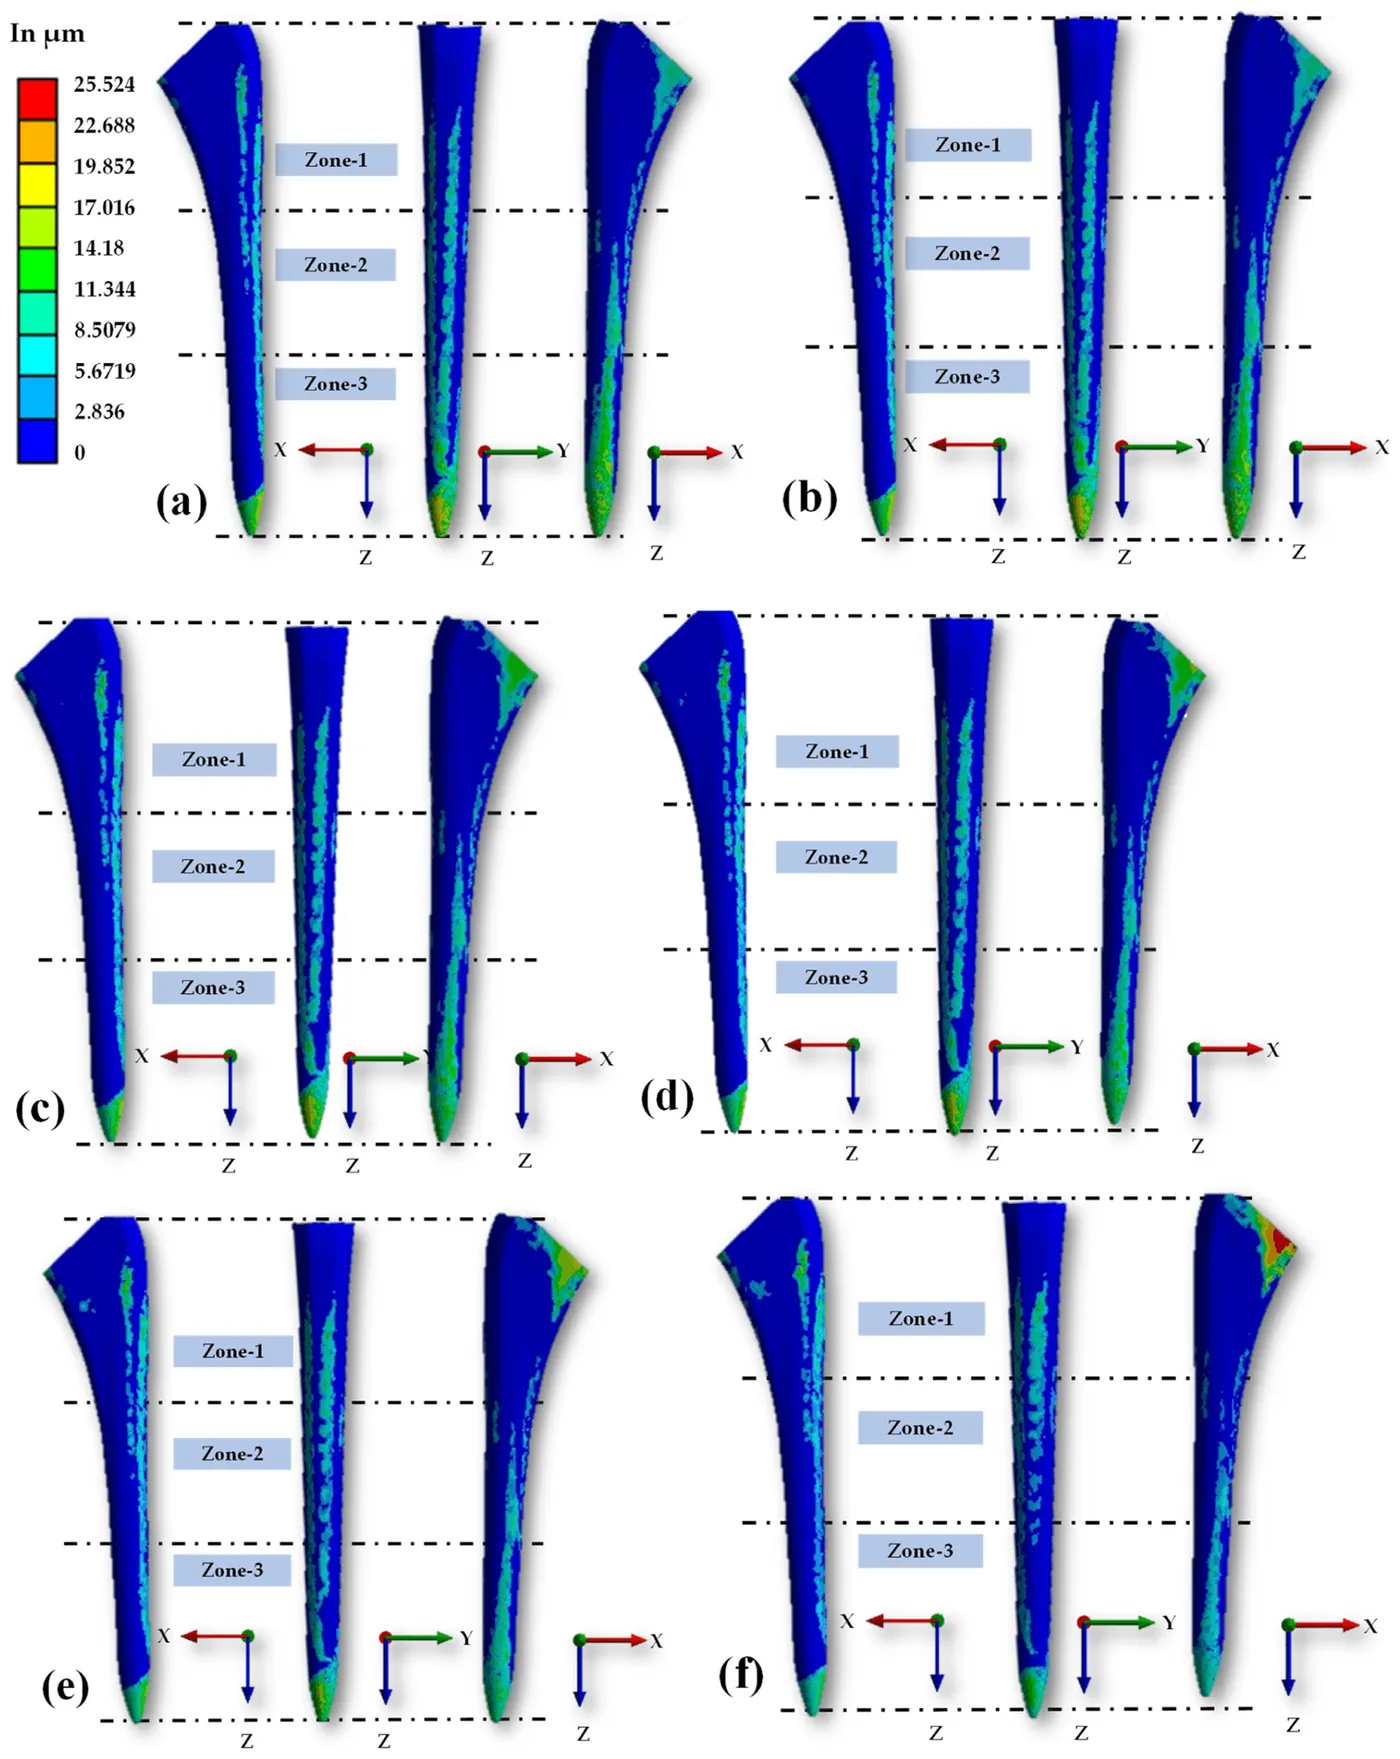
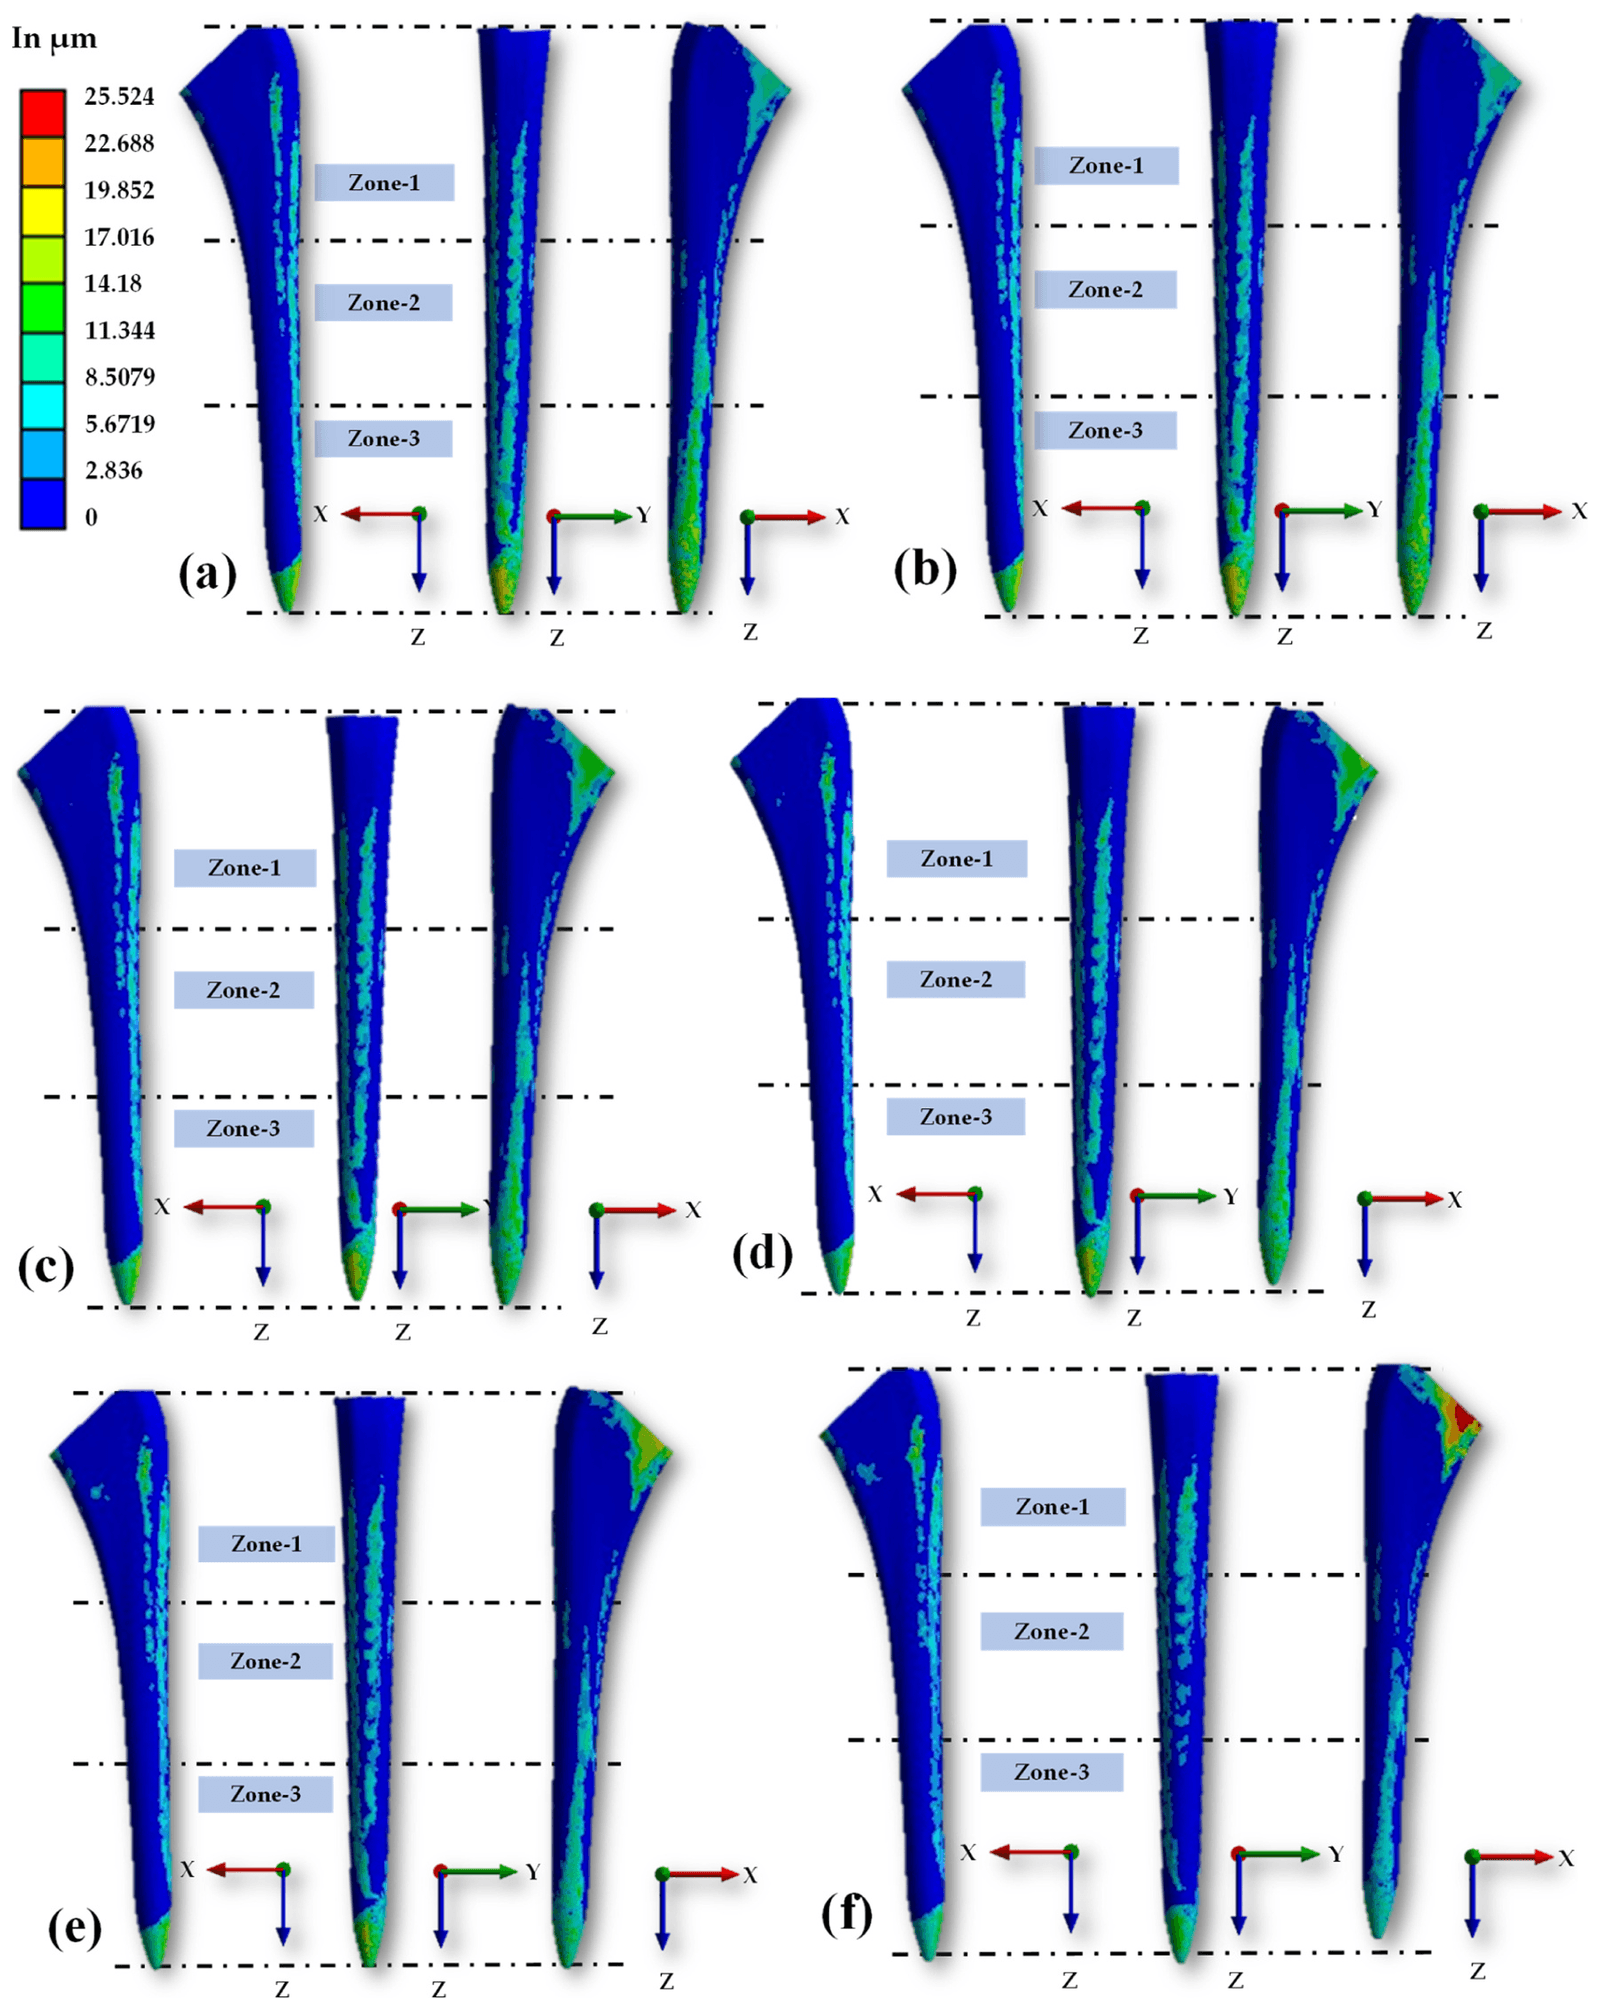
A 3D Summit hip implant was placed in an adult femur model and simulated with six stem materials: Inconel 718, 316 stainless steel, Ti6Al7Nb, Ti6Al4V, TMZF and Ti-33.6Nb-4Sn (TNS). Walking, standing-up and sitting-down loads were applied, with peak resultant forces of 1,859 N, 1,582 N and 1,351 N.
Less stiff materials transferred more stress to most Gruen zones and reduced stress shielding, although zone 3 needed further attention. They also increased overall micro-movement, but TNS remained within the range considered suitable for osteointegration and was identified as the strongest option among the materials tested.
- Stem materials compared
- 6
- Gruen zones analysed
- 7
- Highest micro-movement, with TNS
- 25.5 µm
| Maximum | Average | |
|---|---|---|
| Inconel 718 | 18 µm | 2.2 µm |
| 316 stainless steel | 18.1 µm | 2.39 µm |
| TMZF | 21 µm | 2.7 µm |
| TNS | 25.5 µm | 2.71 µm |
My contribution
For HipXNet, I contributed to the deep learning pipeline, evaluation, data analysis, interpretation and manuscript preparation. In the finite element work, I designed the spiral head–stem model in Fusion 360, reconstructed a commercial implant stem in CAD, and contributed to methodology, software and formal analysis, including the stem-material study. I contributed to the sensor feasibility analysis, the bench-test setup with Hamad Medical Corporation, and the two reviews, including figure preparation for the biomaterials review.
Study scope
The finite element and sensor results come from simulations under specified geometries, materials and loads. HipXNet used a small retrospective image collection and five-fold validation. The reviews summarise published evidence, and clinical testing would be needed before any proposed design or method is used in patient care.
Publications
- HipXNet: Deep Learning Approaches to Detect Aseptic Loosening of Hip Implants Using X-Ray ImagesIEEE Access · 2022
- A Review of Biomaterials and Associated Performance Metrics Analysis in Pre-Clinical Finite Element Model and in Implementation Stages for Total Hip Implant SystemPolymers · 2022
- Surface Acoustic Wave (SAW) Sensors for Hip Implant: A Numerical and Computational Feasibility Investigation Using Finite Element MethodsBiosensors · 2023
- Design and Performance Evaluation of a Novel Spiral Head-Stem Trunnion for Hip Implants Using Finite Element AnalysisMaterials · 2023
- Advancement in total hip implant: a comprehensive review of mechanics and performance parameters across diverse noveltiesJournal of Materials Chemistry B · 2023
- Stress transfer, stress shielding, and micro-movement analysis in the implanted femoral bone region with various hip implant stem materials: A finite element approachMaterials Today Communications · 2024
Data
- Aseptic Loose Hip Implant X-Ray DatabaseKaggle dataset