Wearable biomechanics · 2022–2023
Machine learning for gait analysis: Tai Chi training and neurodegenerative disease detection
Using foot-sensor recordings and machine learning to separate Tai Chi masters from trainees, then to detect ALS, Huntington’s disease and Parkinson’s disease from walking patterns.
Qatar National Research Fund NPRP12S-0227-190164 · Qatar University IRCC-2021-001
Approach
What can walking patterns from foot sensors reveal about long-term training and neurodegenerative disease?
Walking depends on coordination between the nervous system, muscles and joints, so small changes in stride timing and foot loading can carry useful information. This project analysed public foot-sensor recordings in two studies, always testing on people held out from training. The first used interpretable gait features and classical machine learning to study Tai Chi experience. The second combined force signals and gait features in a deep network to detect neurodegenerative disease.
- Record walking with foot sensors
- Extract gait signals and features
- Test on unseen participants
Distinguishing Tai Chi masters from trainees by gait
Computers in Biology and Medicine · 2022
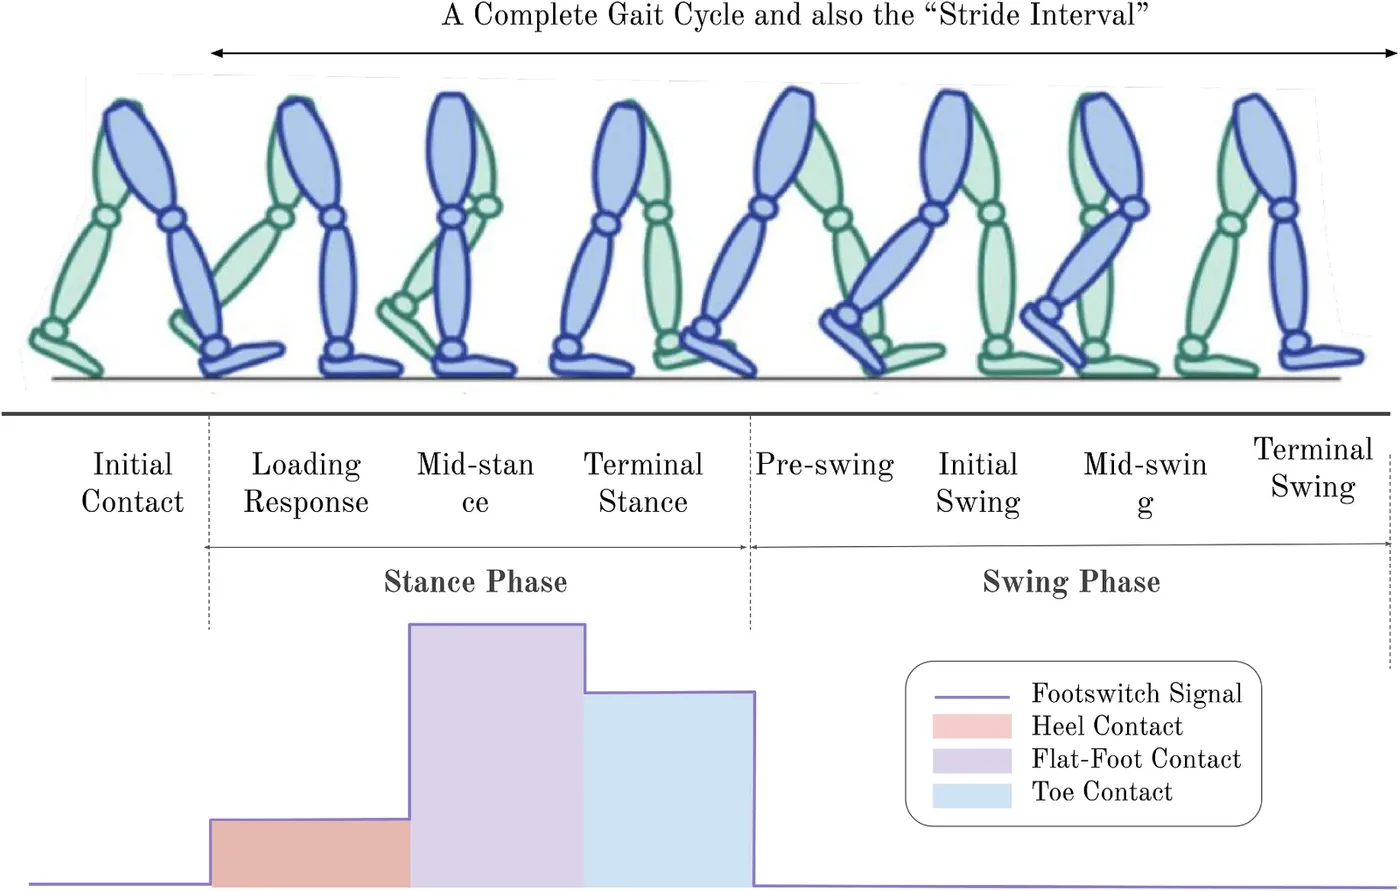
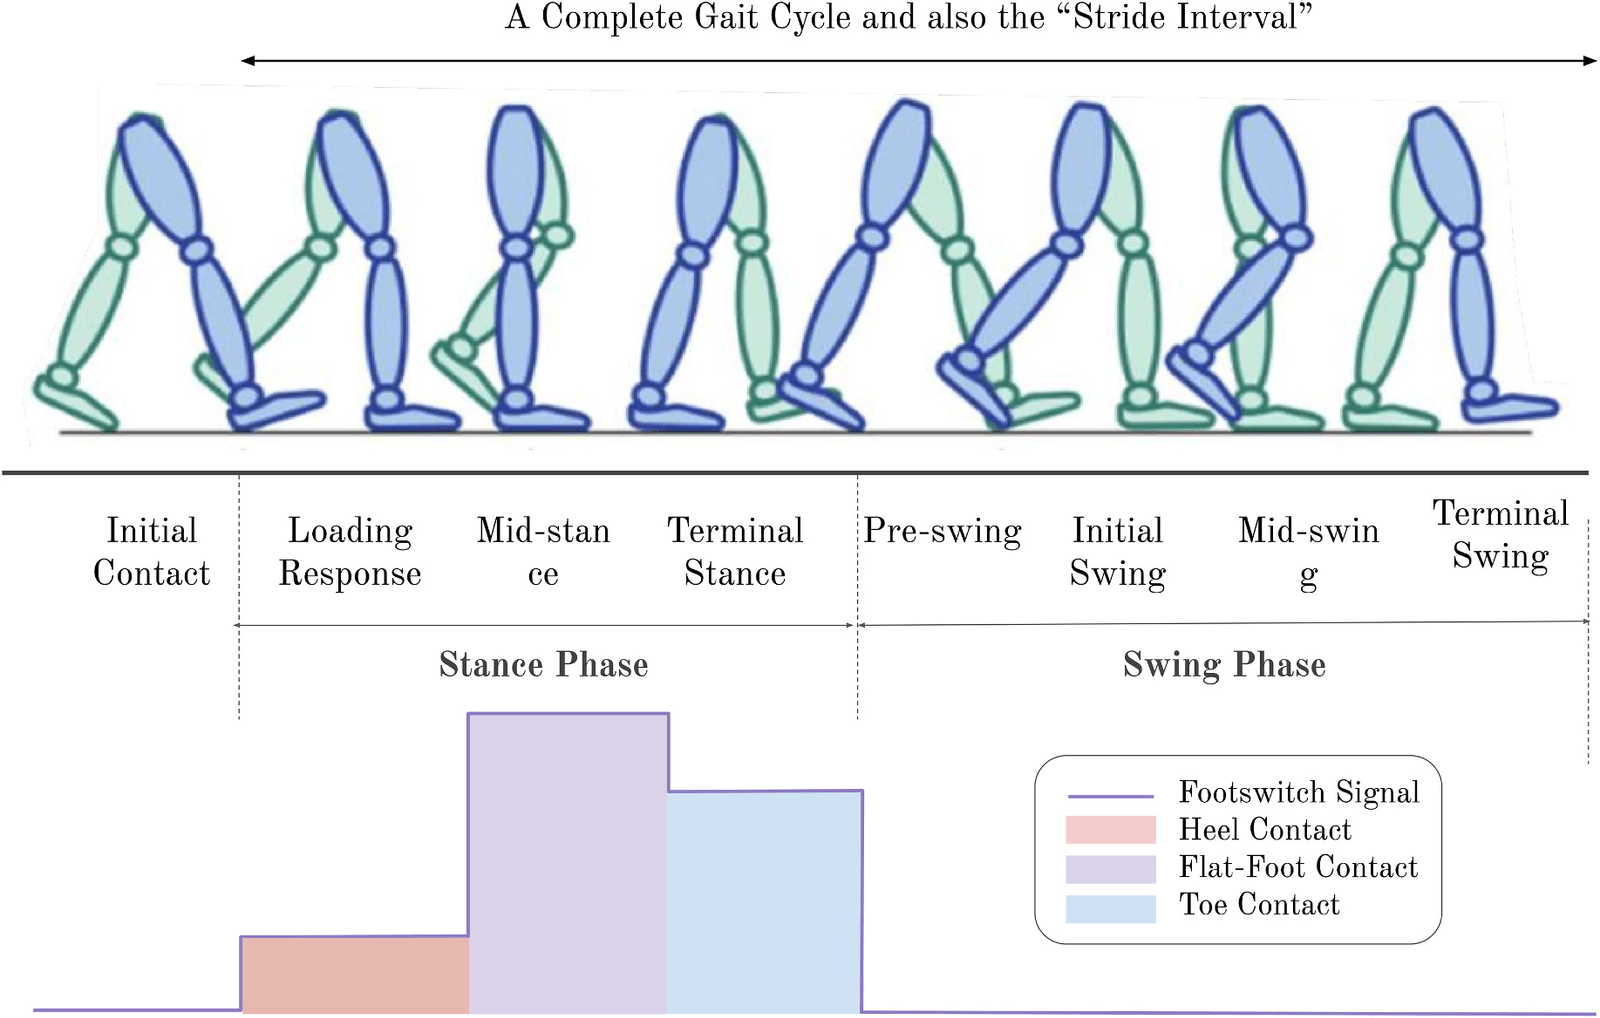
The study used a public PhysioNet dataset of 27 Tai Chi masters with at least five years of training and 30 people who were new to Tai Chi. The second group was recorded before and after six months of training. Heel and toe footswitches captured ordinary walking and dual-task walking, in which participants also performed mental subtraction.
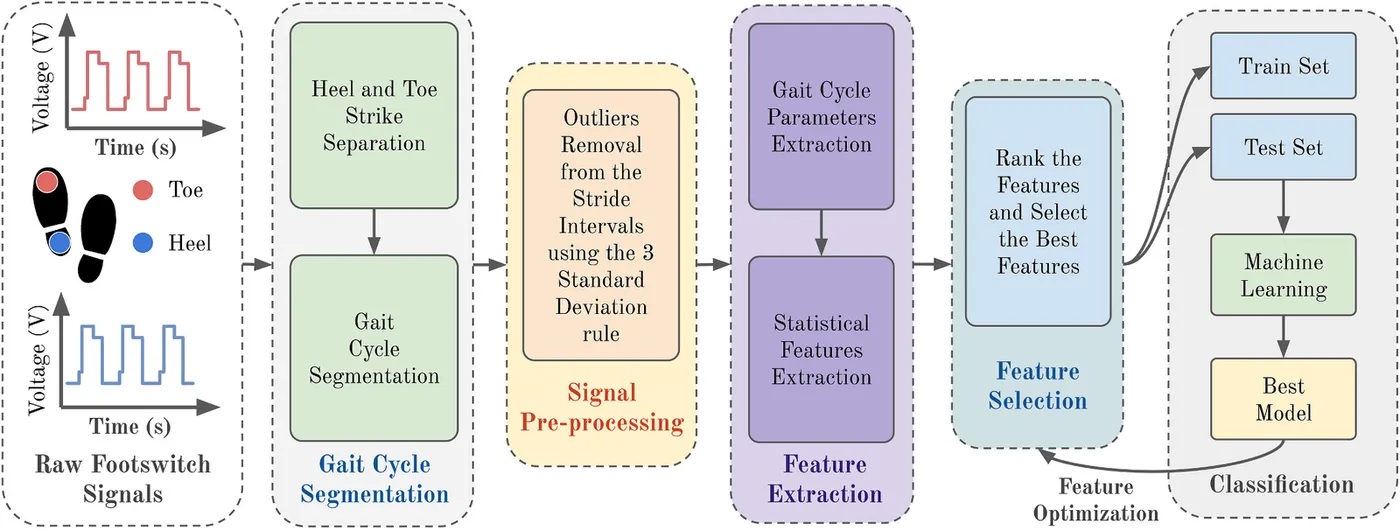
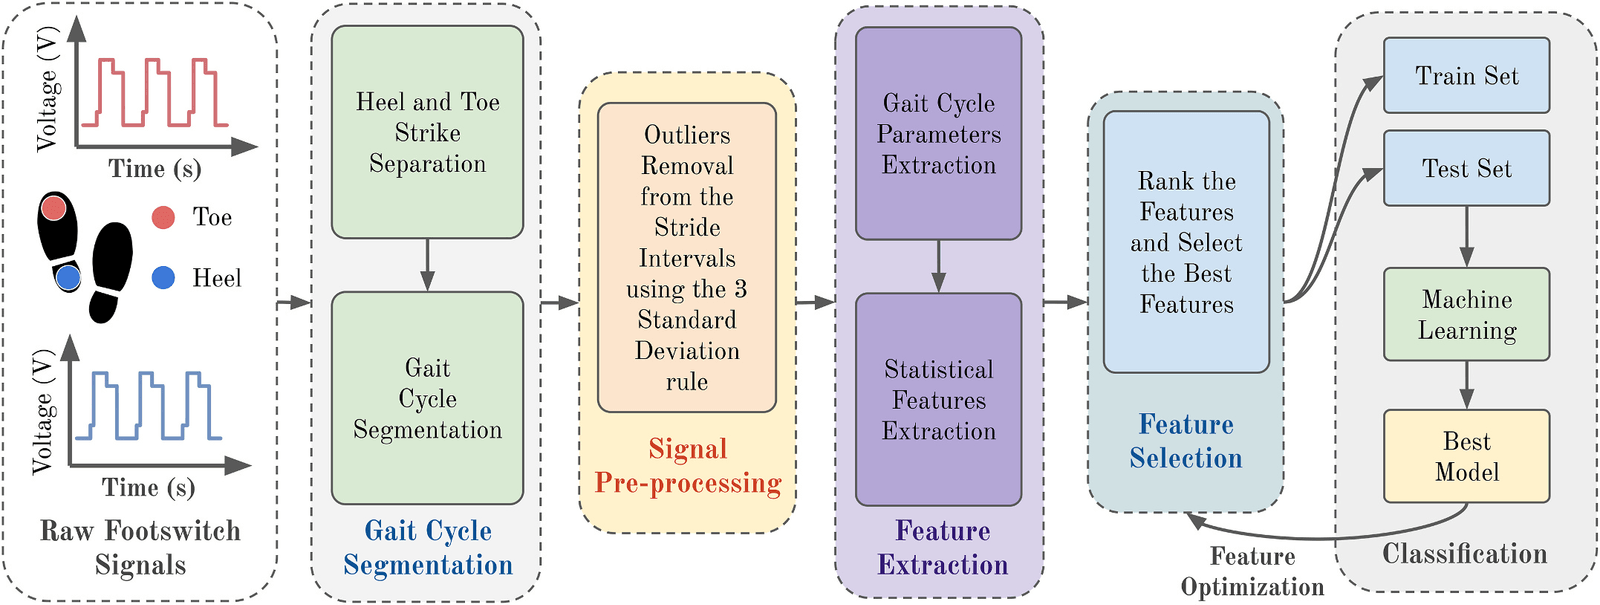
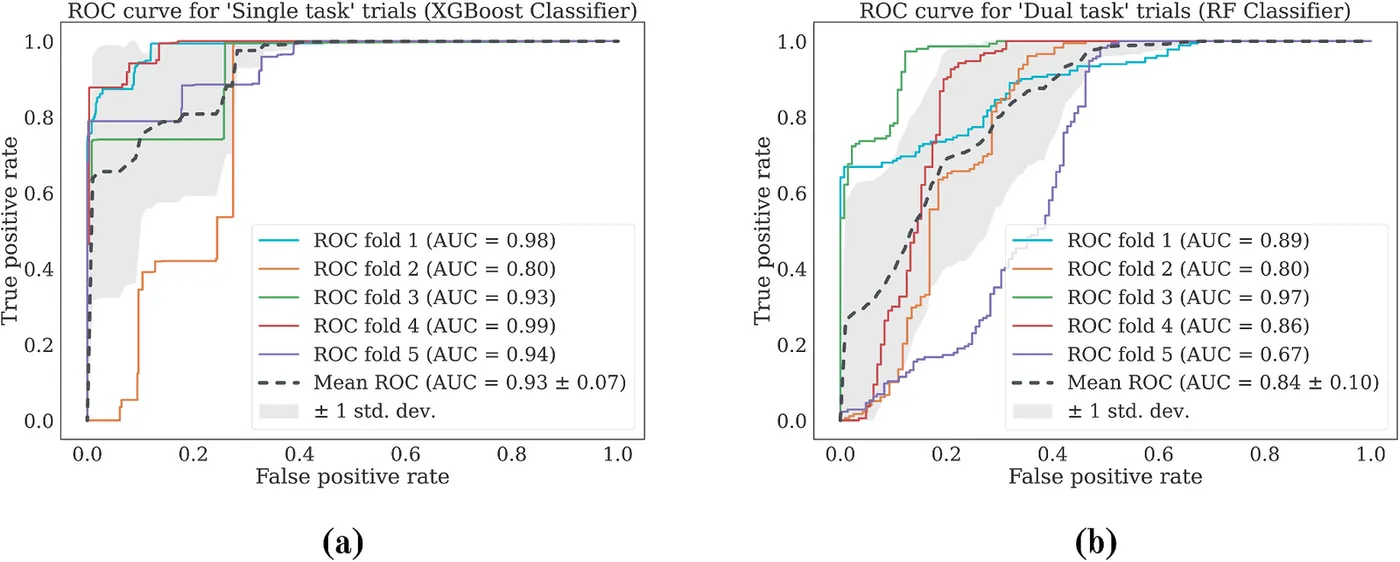
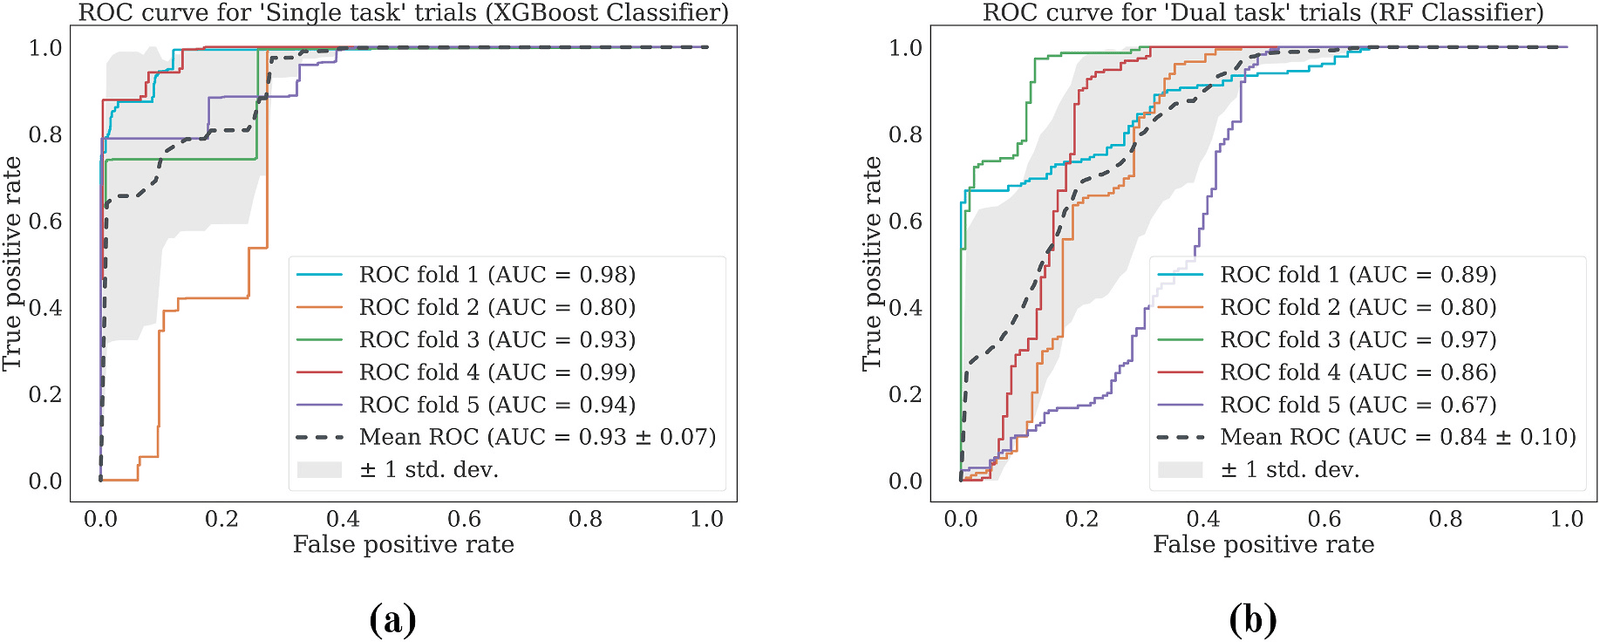
Footswitch signals were split into gait cycles and converted to 15 timing and stride measures for each foot. These were scaled for BMI and sex, then summarised into 165 statistical features. After redundant features were removed, a hybrid method combined four feature rankings. Six classical classifiers were tuned and tested with five-fold cross-validation on separate people.
The two groups were easiest to separate at the first visit, especially during ordinary walking. Accuracy was lower after six months, which the authors suggest may reflect the effect of training. The hybrid ranking gave higher accuracy than any single ranking method in all four settings.
- Accuracy, ordinary walking at the first visit
- 88.17%
- ROC AUC, ordinary walking at the first visit
- 93.10%
- Participants
- 57
| Best classifier | Accuracy | ROC AUC | |
|---|---|---|---|
| First visit, ordinary walking | XGBoost | 88.17% | 93.10% |
| First visit, dual task | Random forest | 82.62% | 84.11% |
| After 6 months, ordinary walking | Random forest | 80.81% | 82.43% |
| After 6 months, dual task | Decision tree | 78.14% | 77.44% |
Detecting neurodegenerative disease from gait with NDDNet
Applied Intelligence · 2023
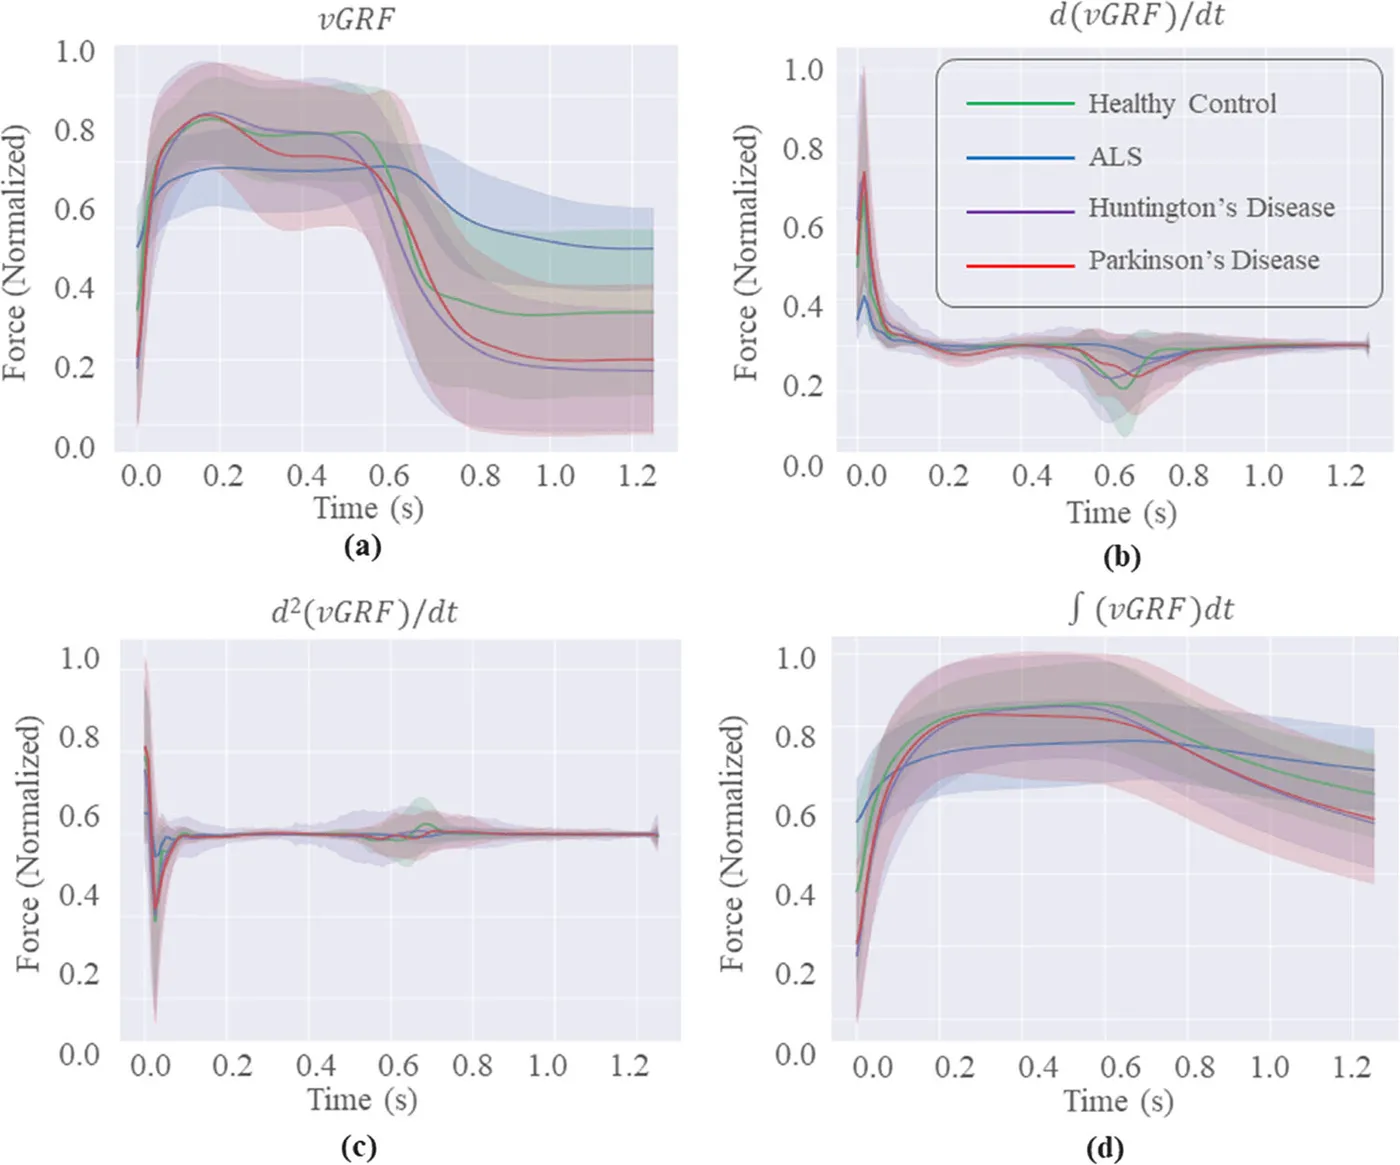
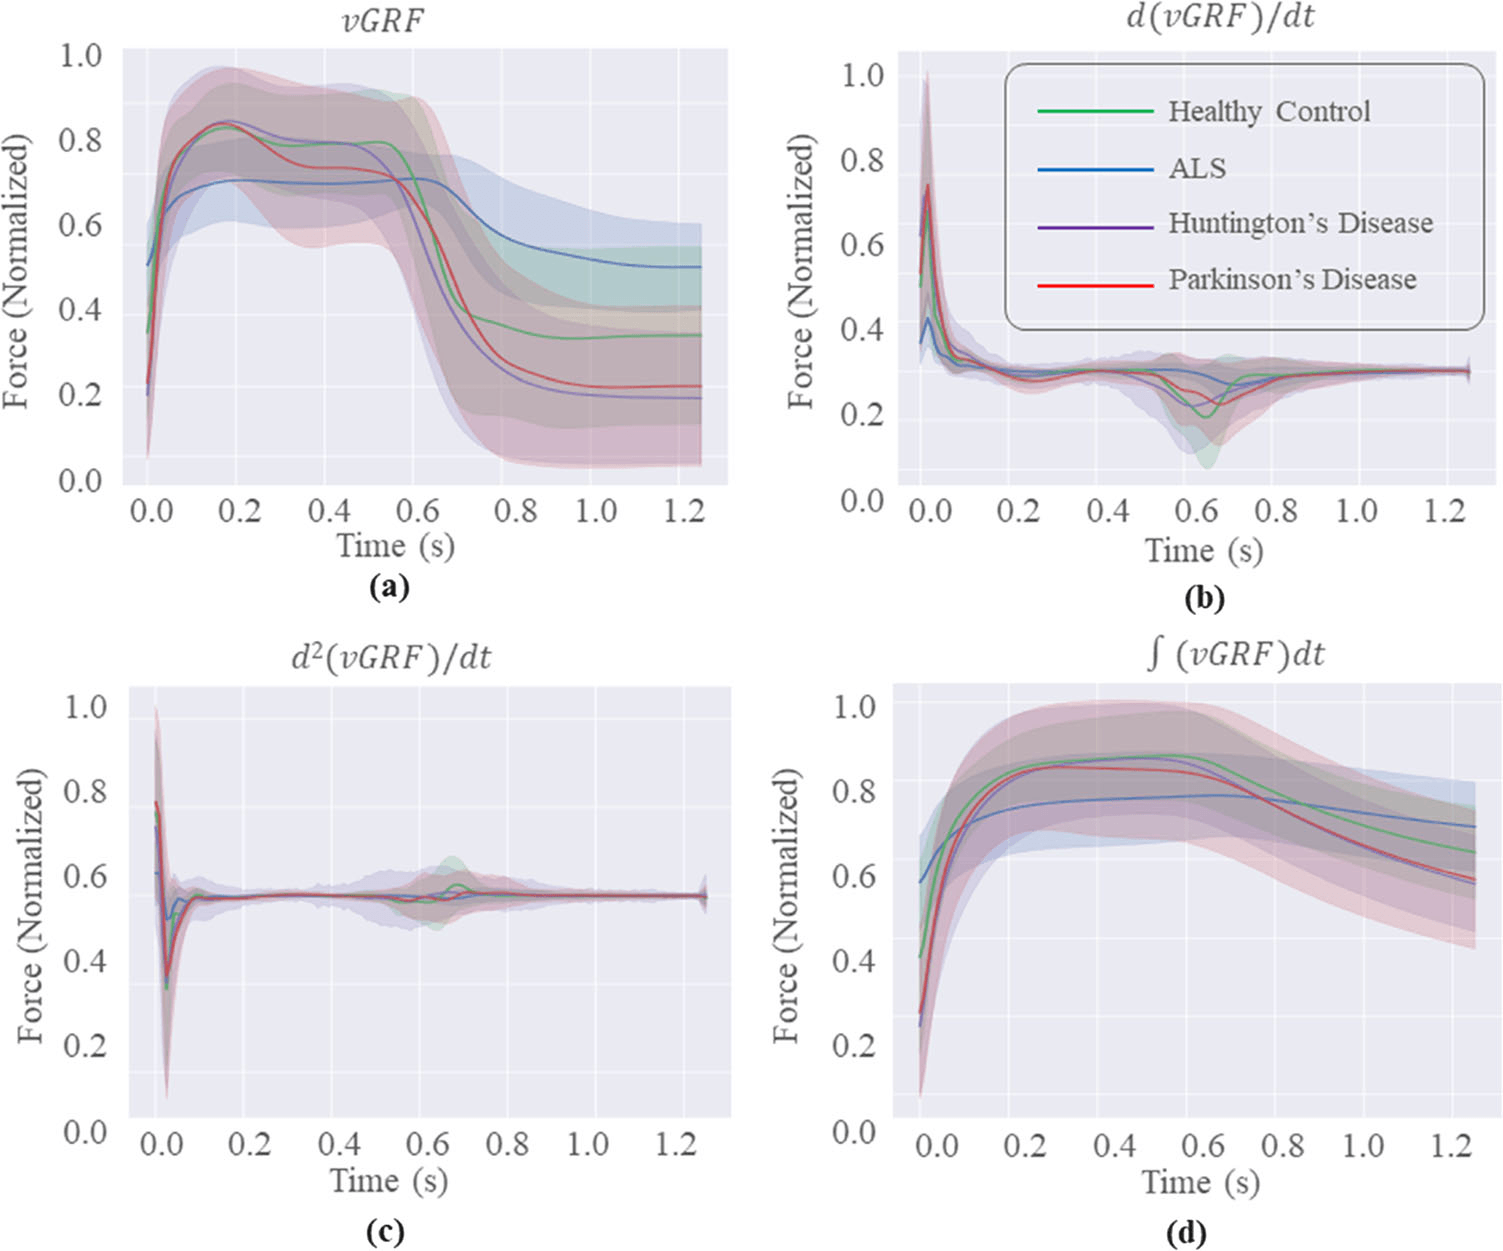
The second study moved from training effects to disease. It used the PhysioNet Gait in Neurodegenerative Disease database, with force-sensor recordings from 16 healthy people, 13 with amyotrophic lateral sclerosis (ALS), 20 with Huntington’s disease and 15 with Parkinson’s disease, each walking for five minutes.
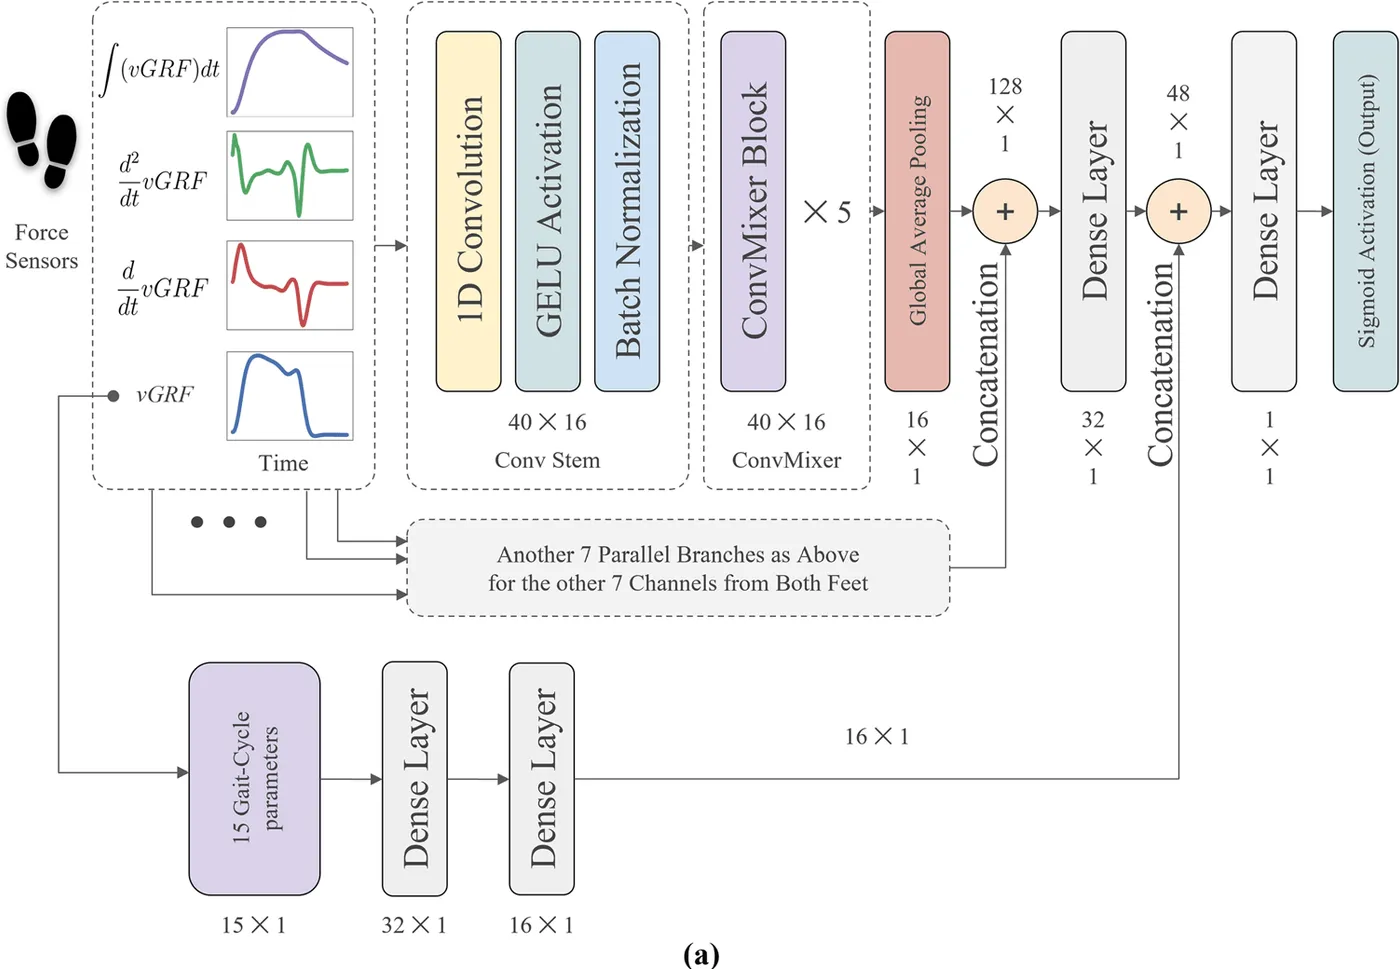
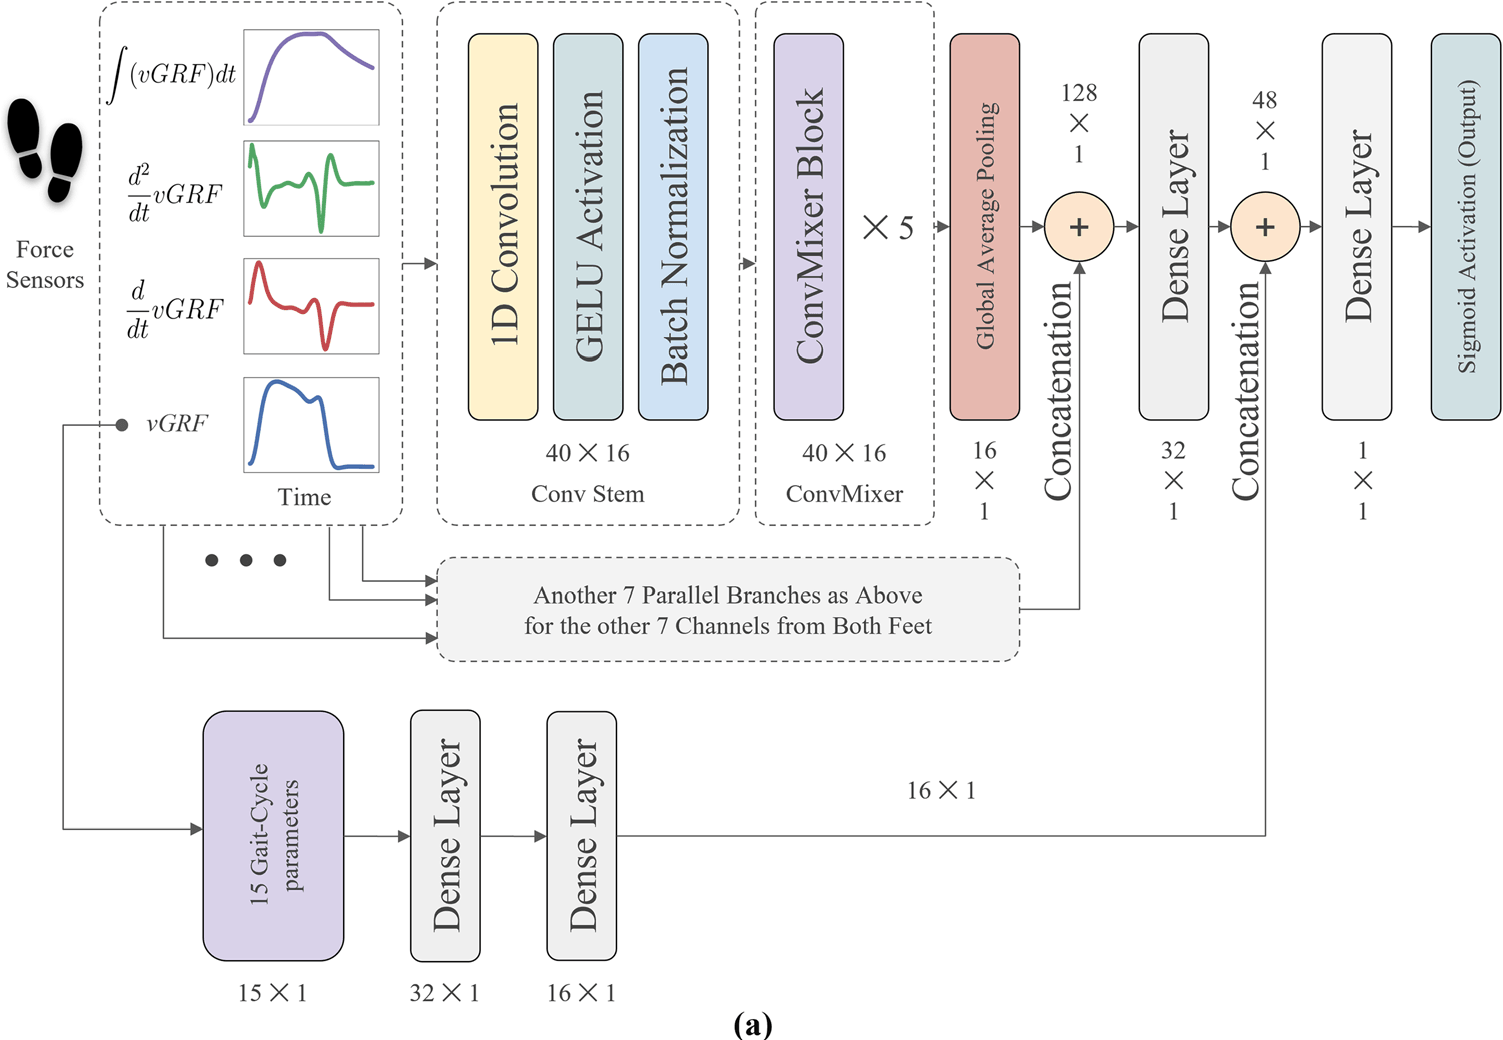
Earlier studies mostly used either force signals or gait measures. NDDNet uses both. Vertical ground reaction force from each foot, with its two derivatives and integral, passes through eight 1D ConvMixer branches, while 15 gait features pass through dense layers. Each model was tested with leave-one-subject-out validation.
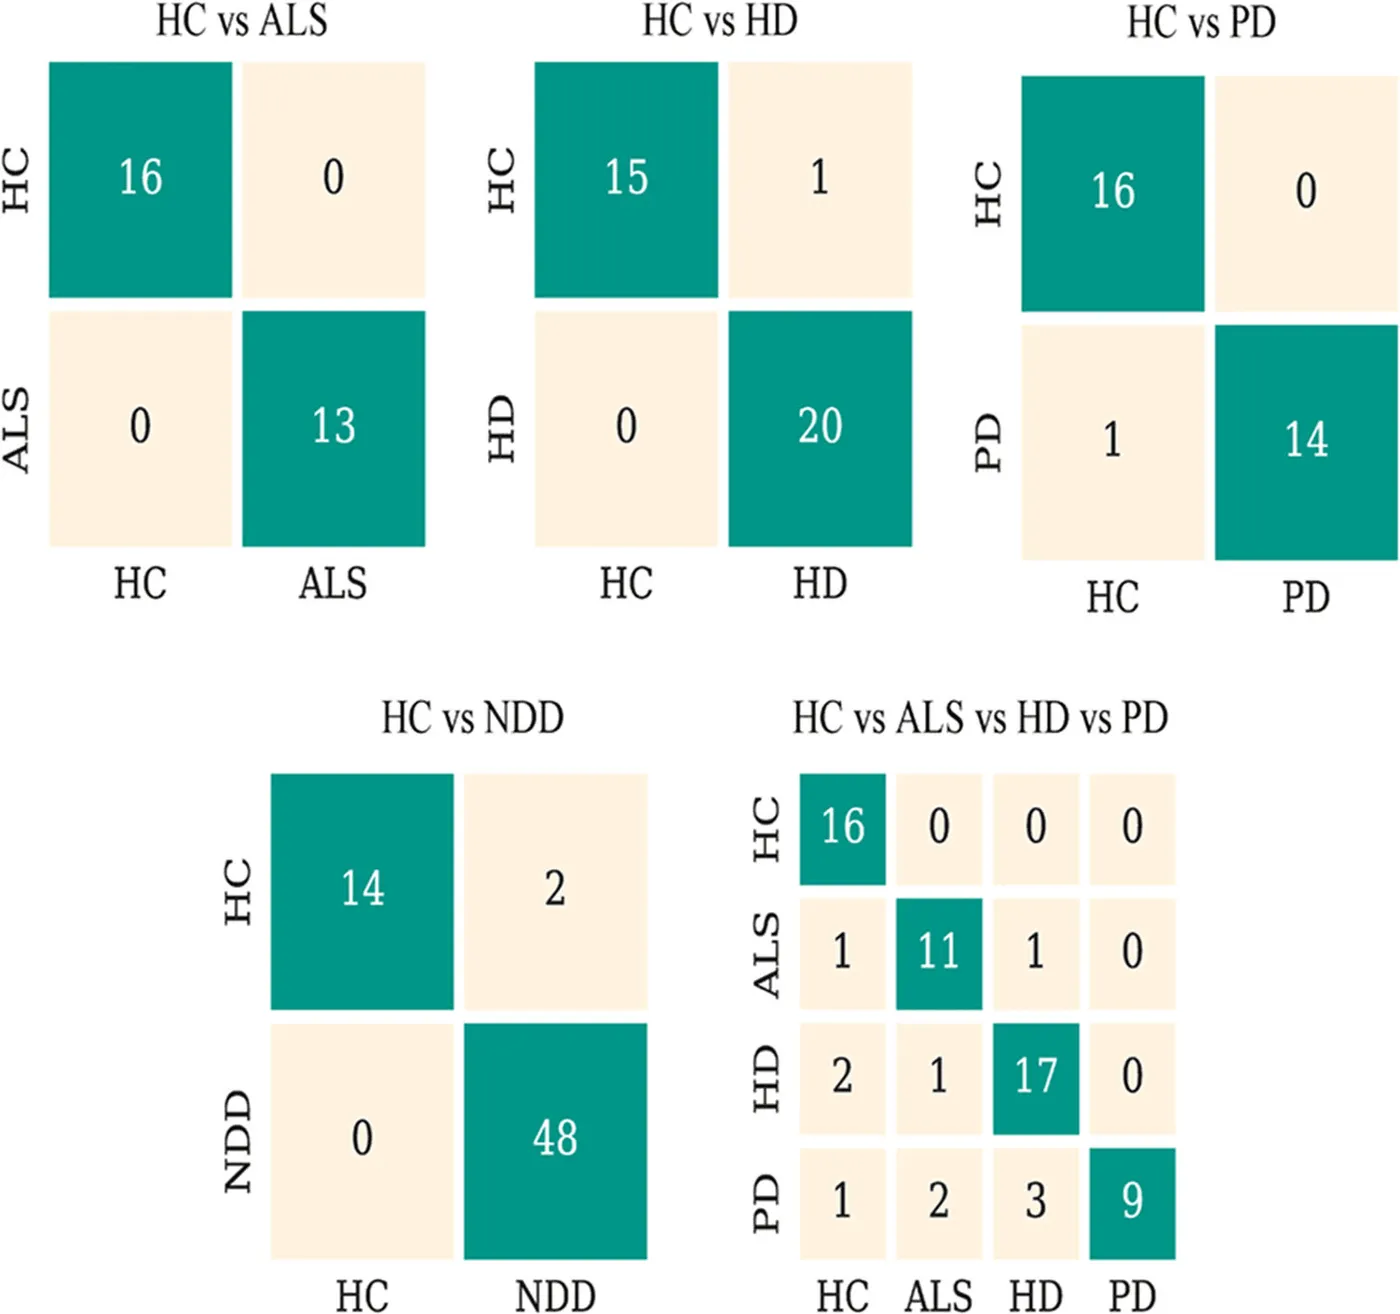
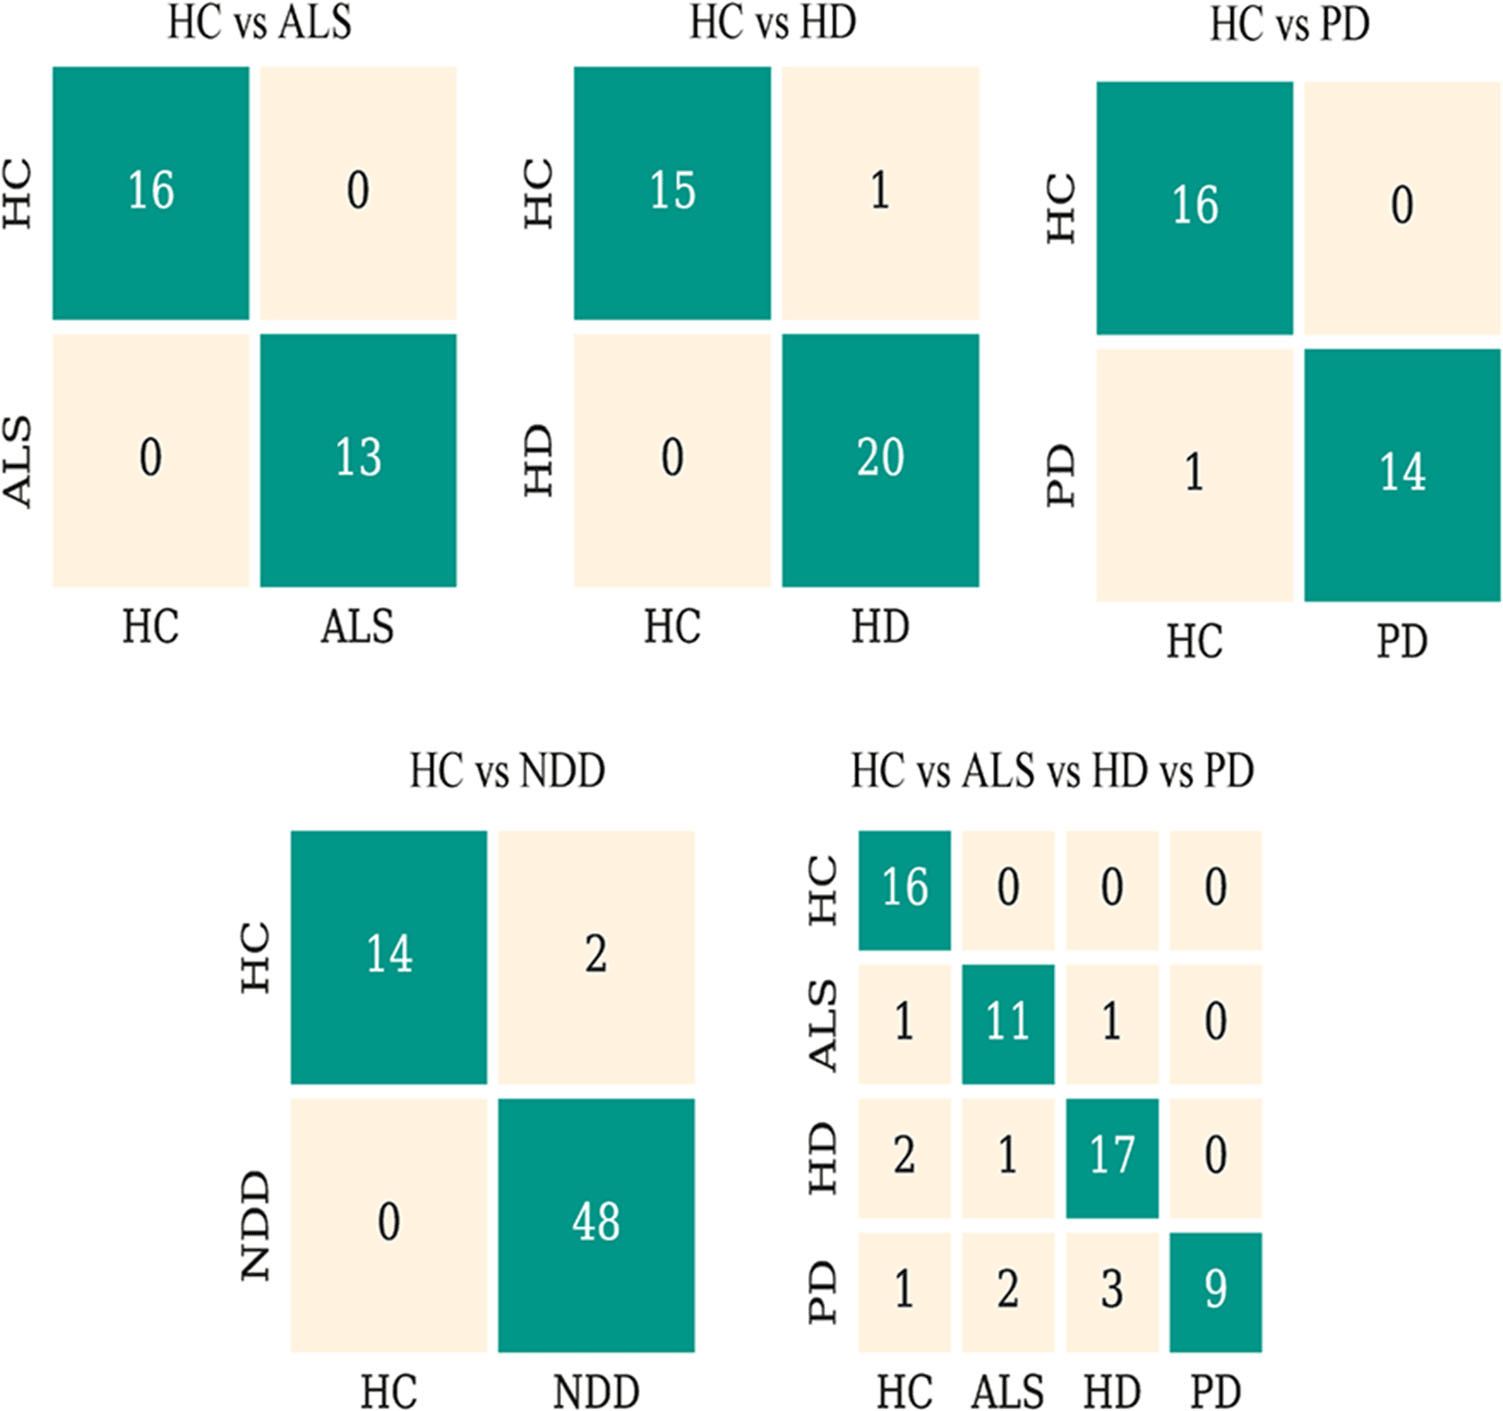
Adding gait features raised accuracy in the four binary tasks by an average of 14 percentage points. In the ALS task, every participant was classified correctly. Separating all four groups at once was harder, particularly for Parkinson’s disease, where the F1 score was 0.60.
- Average accuracy across four binary tasks
- 96.75%
- Average gain from adding gait features
- +14 points
- Model size
- 239 KB
| Force signals only | NDDNet | Participants misclassified | |
|---|---|---|---|
| ALS vs healthy | 92% | 100% | 0 of 29 |
| Huntington’s vs healthy | 79% | 97% | 1 of 36 |
| Parkinson’s vs healthy | 81% | 94% | 1 of 31 |
| Any disease vs healthy | 78% | 96% | 2 of 64 |
| All four groups | 73% | 83% | 11 of 64 |
My contribution
In the Tai Chi study, I contributed to gait-data analysis, classical machine learning evaluation, interpretation of the findings and manuscript review. For NDDNet, I contributed to gait-data analysis, deep learning evaluation, interpretation of the findings and manuscript review and revision.
Study scope
Both studies are retrospective analyses of public datasets without an external test cohort. The Tai Chi study shows gait differences between experienced and newly trained people, but it does not prove that training caused every difference, and footswitches record timing rather than force. The NDDNet groups contain 13 to 20 people and differ in age and sex balance, so larger clinical cohorts are needed before diagnostic use.
Publications
- NDDNet: a deep learning model for predicting neurodegenerative diseases from gait patternApplied Intelligence · 2023
- An investigation to study the effects of Tai Chi on human gait dynamics using classical machine learningComputers in Biology and Medicine · 2022
Code
- NDDNetResearch software and repository details