Intelligent energy systems · 2021–2022
Detecting electric-vehicle charging in household smart-meter data
Using household smart-meter data to flag likely electric-vehicle charging periods and help distribution network operators plan for charging demand.
Omdena AI challenge · Energy Tech Hub and Centre for New Energy Technologies (C4NET) · Completed team project
Approach
Can household smart-meter data show when electric vehicles are charging, without monitoring each charger directly?
Growing electric-vehicle use can create unexpected peak loads and voltage problems on distribution networks, yet tracking charging across many homes is costly. In this eight-week Omdena challenge, an international team of more than 45 contributors used smart-meter data to detect likely charging without extra sensors and to show when it tends to happen. The aim was to give distribution network service providers a clearer picture of charging demand for network planning, upgrades and operations.
- Gather studies and data sources
- Prepare and explore meter data
- Flag likely charging periods
Building a shared evidence base
Task co-lead
Before modelling, the team needed a shared picture of how charging had been detected from meter data in earlier work. I co-led the resources task, which collected published studies and data sources in a shared library with short summaries.
By the third week the library listed 25 published studies, including work on detecting charging from hourly smart-meter data and on machine learning for charging-infrastructure planning. References were sorted into essential and supporting reading so the other task teams knew where to start, and open datasets used in earlier studies were noted for further exploration.
Comparing households with and without electric vehicles
Team analysis
The partner data covered about 14 months of half-hourly consumption, five-minute power-quality measurements and a list of households with electric vehicles, including their car models. The team merged consumption and power-quality data at a common half-hourly resolution, checked data quality and engineered summary features.
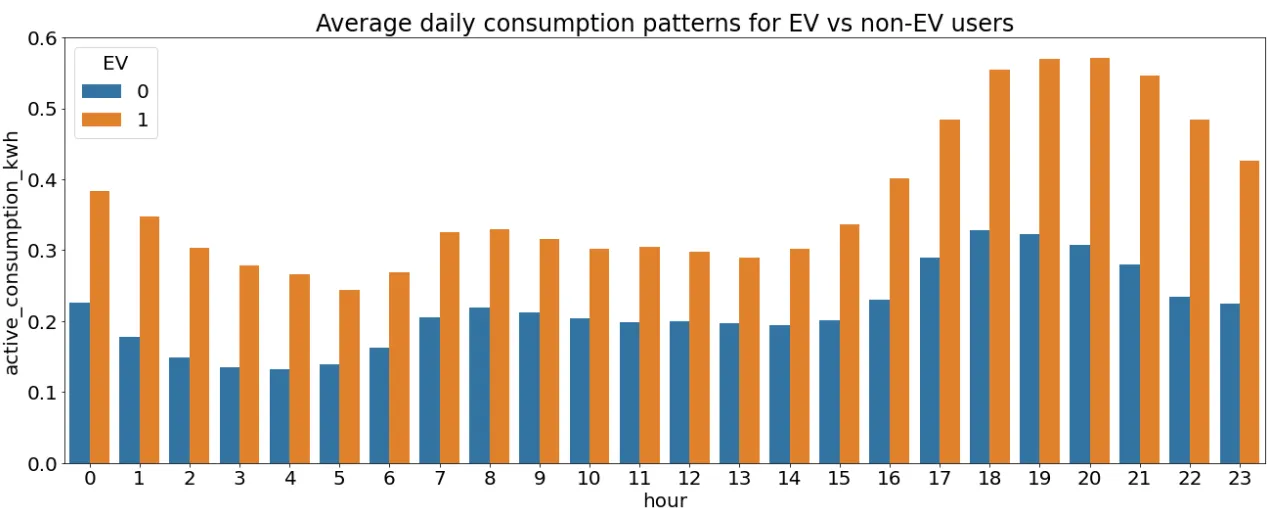
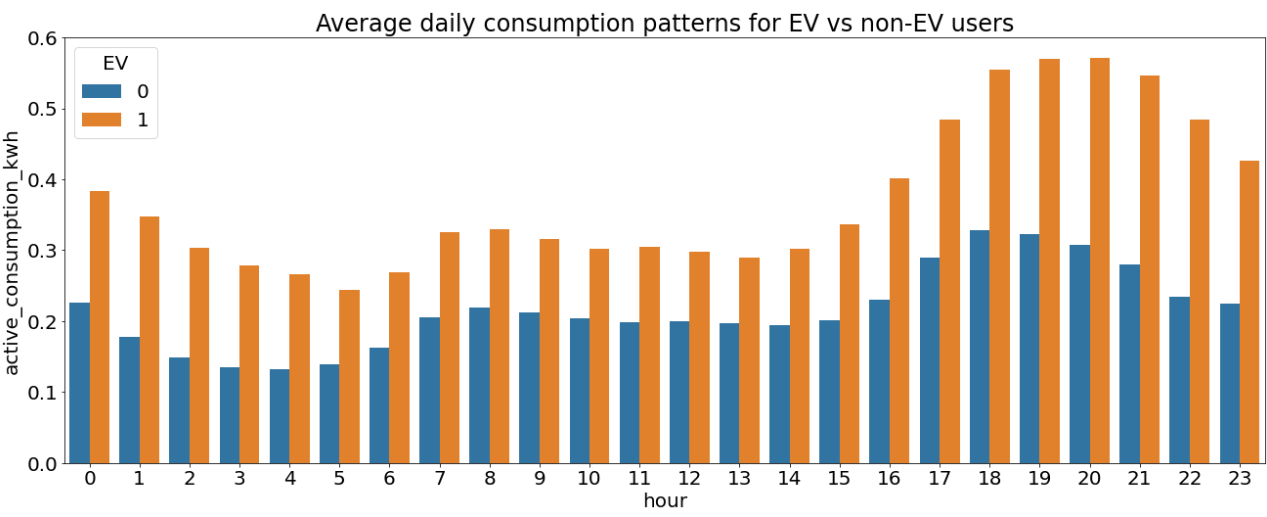
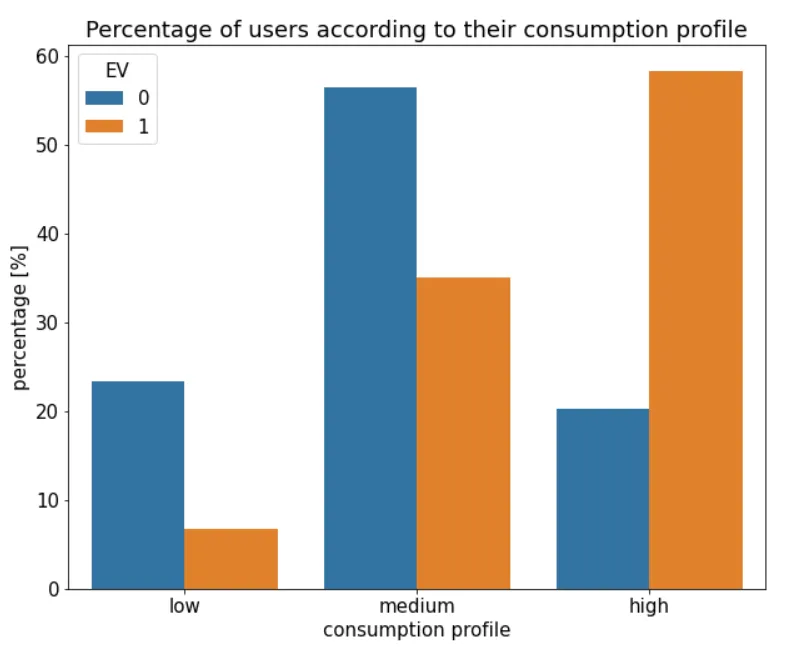
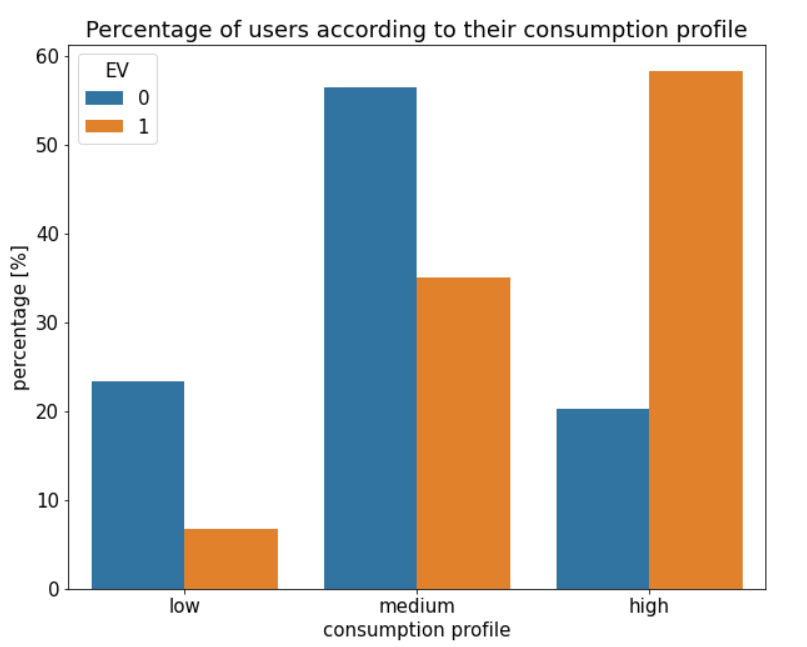
Households with an electric vehicle used more electricity at every hour on average, and almost twice as much as other households between 18:00 and 05:00, which fits charging after work and overnight. Consumption also rose in winter, from May to October. When households were grouped by consumption quartile, 58% of those with a vehicle fell in the highest group, compared with 20% of other households.
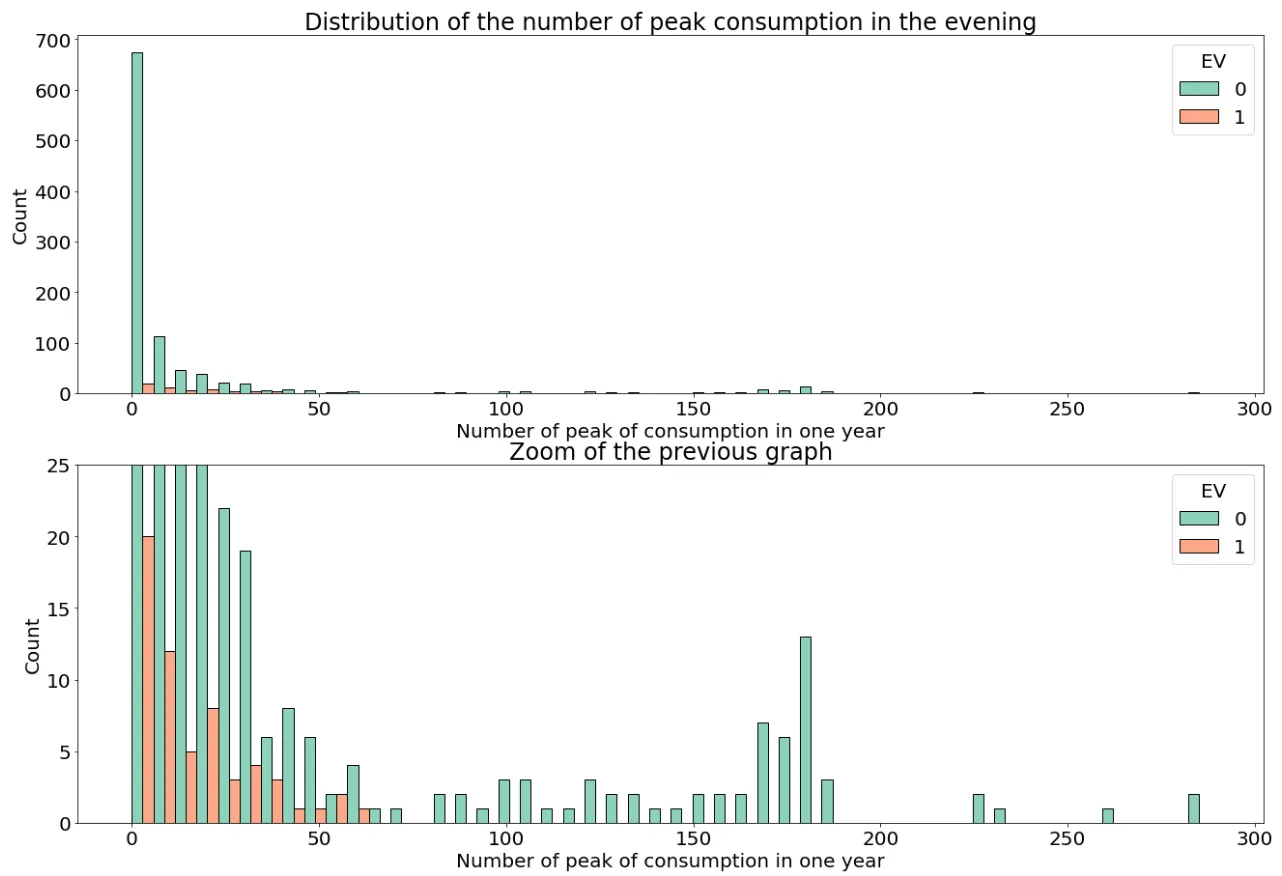
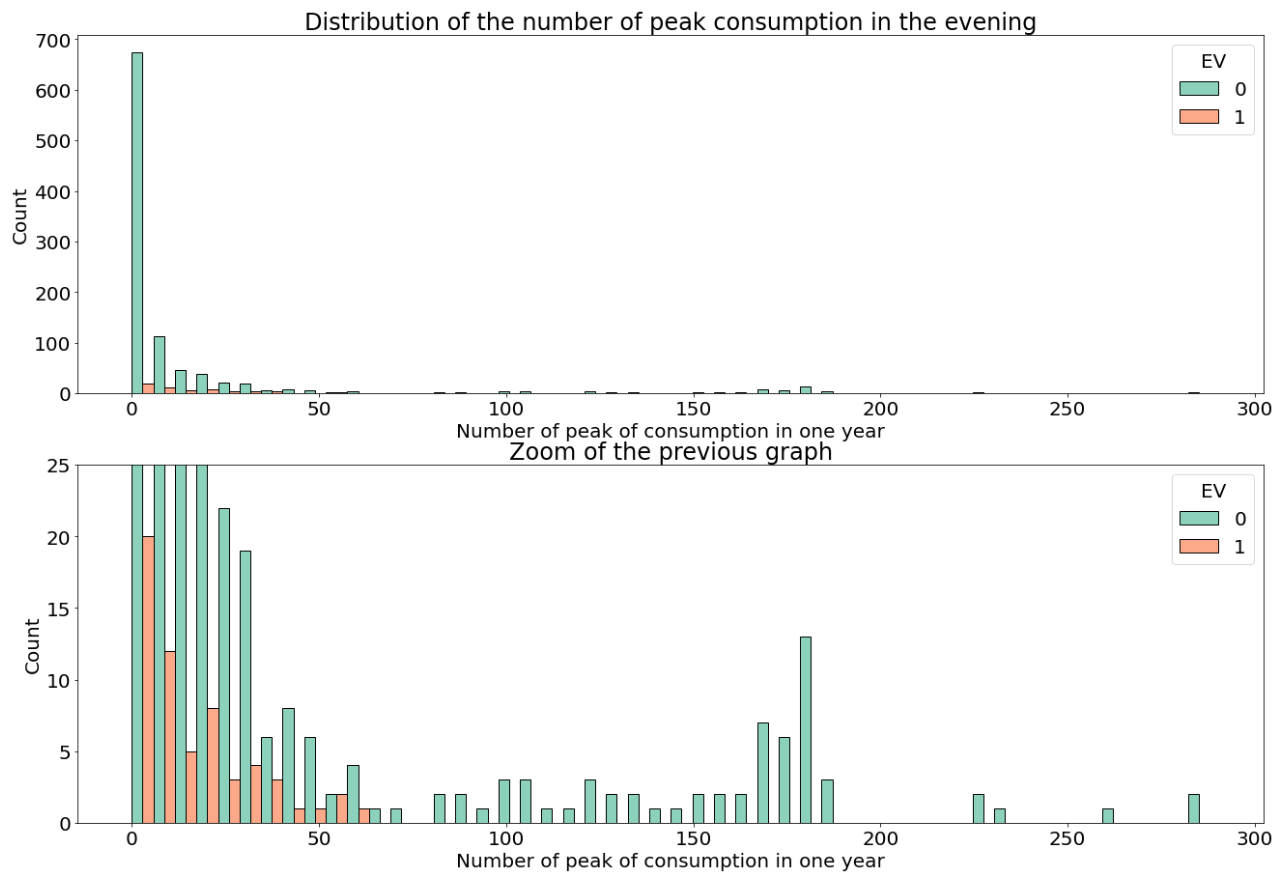
Not every night-time spike pointed to a vehicle. About 15% of households showed a sharp peak at 23:00 or midnight, which moved by an hour with daylight saving. The partner suggested timed hot-water systems as the likely cause. Most households with a vehicle had fewer than 50 such peaks a year, whereas the hot-water group had roughly 100 to 300, so these regular peaks could be separated from charging.
- Households with an electric vehicle
- 5.6%
- Use by vehicle households between 18:00 and 05:00
- Almost 2×
- Vehicle households in the medium or high consumption groups
- 93%
| Share of households | What the analysis showed | |
|---|---|---|
| Electric vehicle owners | 5.6% | Higher use at every hour, especially from 18:00 to 05:00 |
| Regular late-night peaks | 15.3% | Fixed-time peaks most likely from hot-water systems rather than charging |
| Electricity generators | 15.5% | Produced electricity at some point in the period |
| Long periods without consumption | 6.5% | Not explained by holiday or weekend-only use |
Flagging likely charging periods
Delivered to project partners · February 2022
For households with electric vehicles, a clustering approach grouped half-hourly readings into low, medium and high consumption. It used three features: energy use, its rolling three-hour average, and current from the meter. Spikes in both consumption and current were flagged as likely charging.
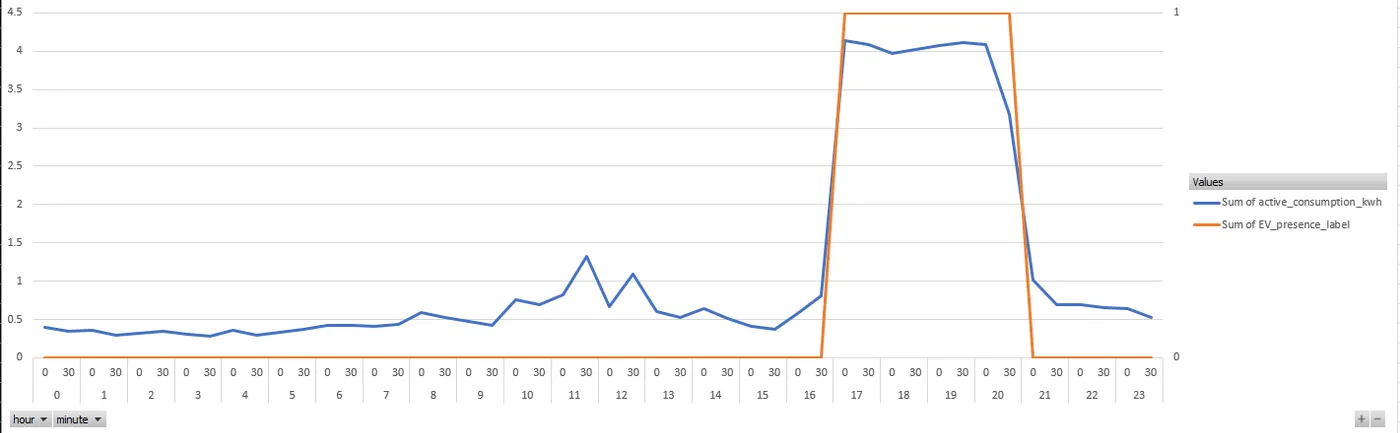
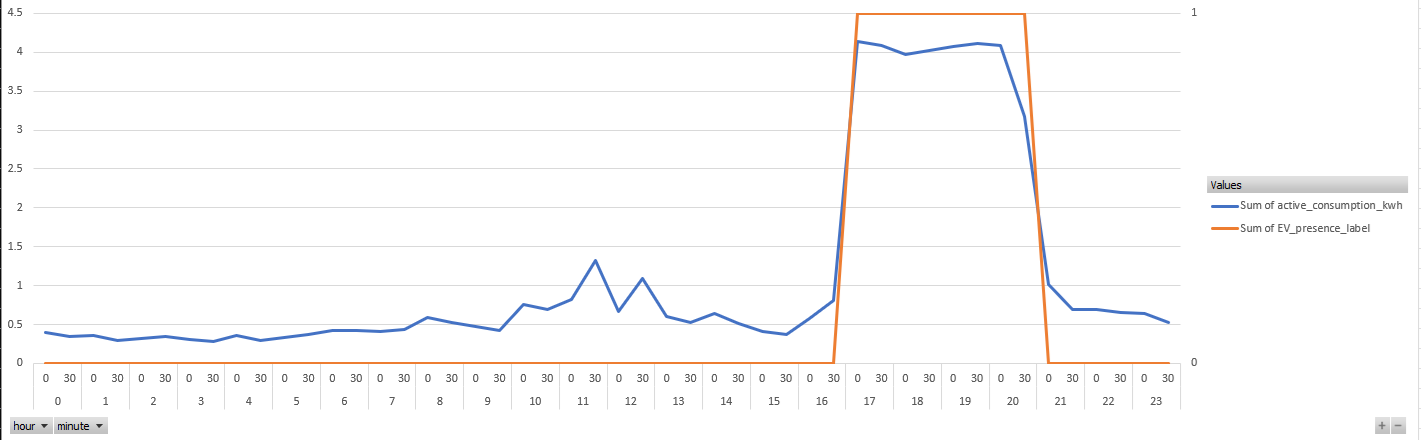
The results were delivered as a flat file with a cluster and charging flag for every half-hour of each vehicle household, and as an Excel dashboard that filters by meter, vehicle make and model, month and day. In one example household, charging was flagged for about three and a half hours in the early evening, when consumption rose to about 4 kWh per half-hour.
The approach finds consumption spikes but cannot confirm on its own that a vehicle caused them. Grouping households by summary statistics was also tried but was not conclusive. The team proposed follow-on work to identify households with electric vehicles, estimate charging power and recognise vehicle types.
- Consumption clusters: low, medium and high
- 3
- Input features per half-hour
- 3
| Purpose | |
|---|---|
| Resources library | Gives every task team a common set of studies and data sources |
| Merged dataset | Aligns consumption and power-quality measurements at half-hourly resolution |
| Clustering model | Flags consumption and current spikes that suggest charging |
| Flat file and Excel dashboard | Let network operators review flagged periods by meter, vehicle and date |
My contribution
As Lead Machine Learning Engineer, I co-led the resources task, which compiled and organised the studies and data sources used across the challenge. I also contributed to the smart-meter analysis, including exploratory analysis, clustering and time-series modelling.
Study scope
The analysis used one network’s customer data over about 14 months, so patterns may differ elsewhere. Charging times were not recorded, so flagged periods indicate likely rather than confirmed charging, and a spike can also come from other household loads.