Medical imaging · 2021–2022
COVID-19 detection, localisation and severity grading from chest X-ray and CT
Building the COVID-QU-Ex benchmark of 33,920 chest X-rays and deep learning systems that outline the lungs, localise infection and grade its severity on X-ray and CT.
Qatar University COVID-19 Emergency Response Grant QUERG-CENG-2020-1 · Qatar National Research Fund UREP28-144-3-046
Approach
Beyond detecting COVID-19, can chest images show where the infection is and how much of the lung it affects?
During the pandemic, many imaging models only labelled an image as positive or negative, often after training on a few hundred COVID-19 cases. This work took a broader approach: segment the lungs, segment the infection within them, and use the two masks to detect disease, show its location and measure its extent. It was developed on CT and on chest X-ray, the faster and more widely available test, supported by a large public X-ray benchmark.
- Curate images and lung masks
- Segment lungs and infection
- Detect, localise and grade
Segmenting infection and grading severity on CT
Diagnostics · 2021
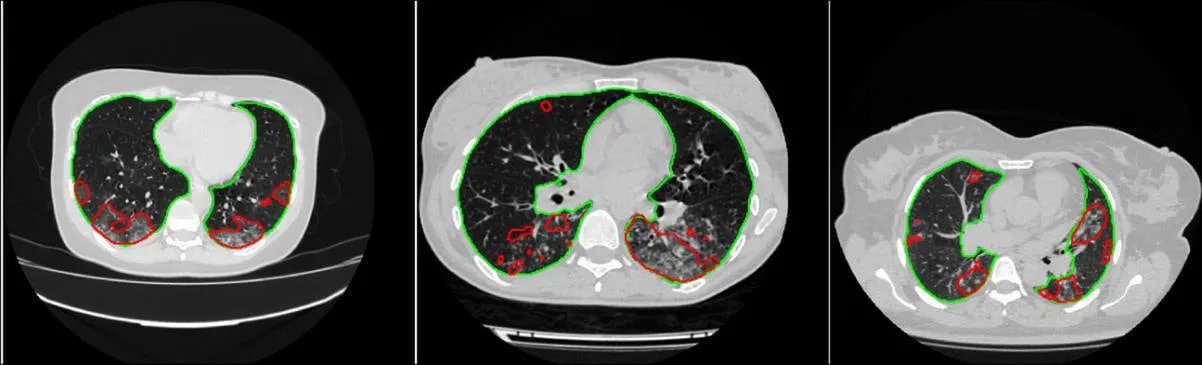
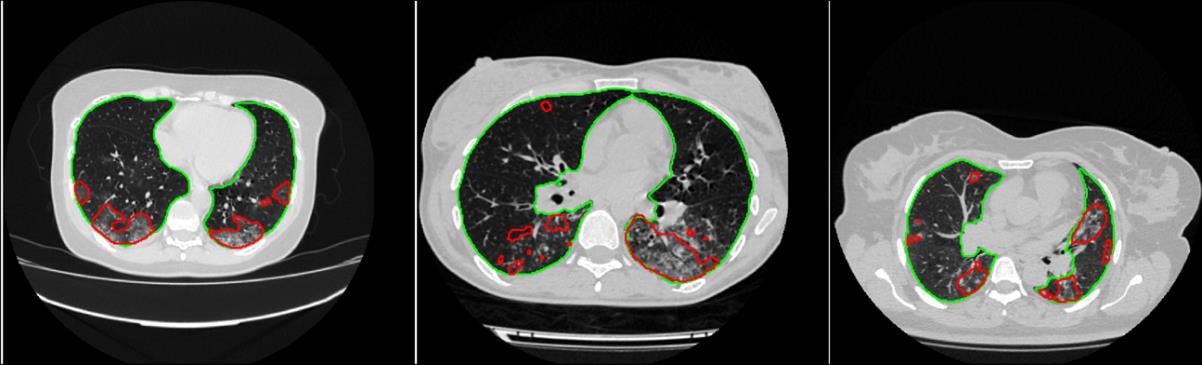
The CT system works in cascade: one network outlines the lungs, a second finds infection inside them, and the ratio of the two gives the percentage of lung involved. UNet and Feature Pyramid Networks with DenseNet and ResNet encoders were compared on public CT sets with expert masks, using cross-validation.
The percentage of infected lung then assigns each patient to a severity grade: below 25% is mild, 25–50% moderate, 50–75% severe and 75% or more critical. This was tested on MosMedData, an independent set of 1,110 patients and 46,411 slices. Grading was strongest for healthy and mild cases. Moderate and severe cases were harder to separate, and only two patients were in the critical group.
- Lung segmentation Dice
- 97.19%
- Infection segmentation Dice
- 94.13%
- COVID-19 detection sensitivity (98.72% specificity)
- 99.64%
| Patients | Correctly graded | Sensitivity | |
|---|---|---|---|
| Healthy | 254 | 242 | 95.28% |
| Mild | 684 | 676 | 98.83% |
| Moderate | 125 | 89 | 71.20% |
| Severe | 45 | 35 | 77.78% |
| Critical | 2 | 2 | 100% |
Building the COVID-QU-Ex chest X-ray benchmark
Public dataset · 2021
Most early COVID-19 X-ray studies relied on a few hundred positive images. The team compiled 33,920 frontal chest X-rays from public sources and removed duplicates and very poor images, leaving 11,956 COVID-19, 11,263 other lung infection and 10,701 normal images.
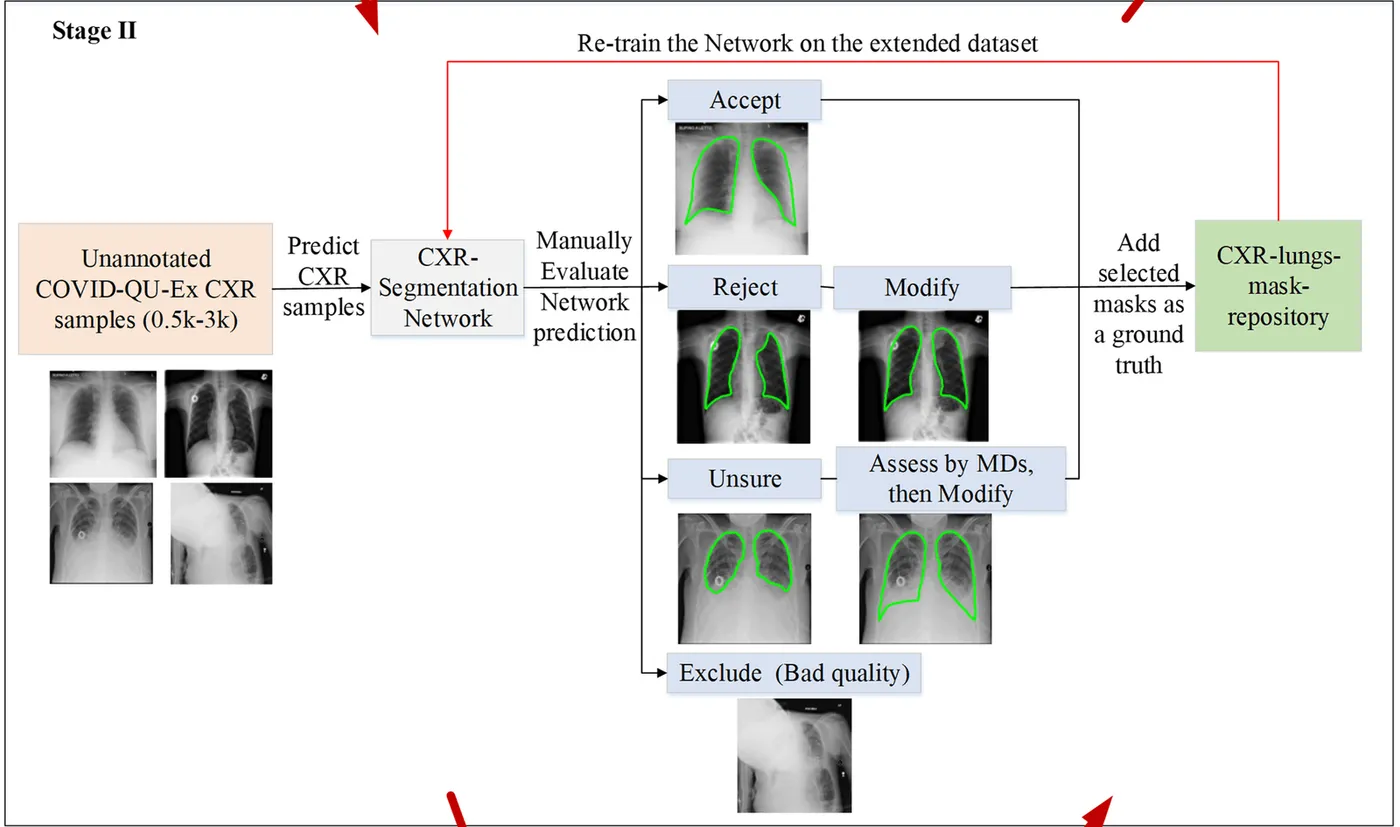
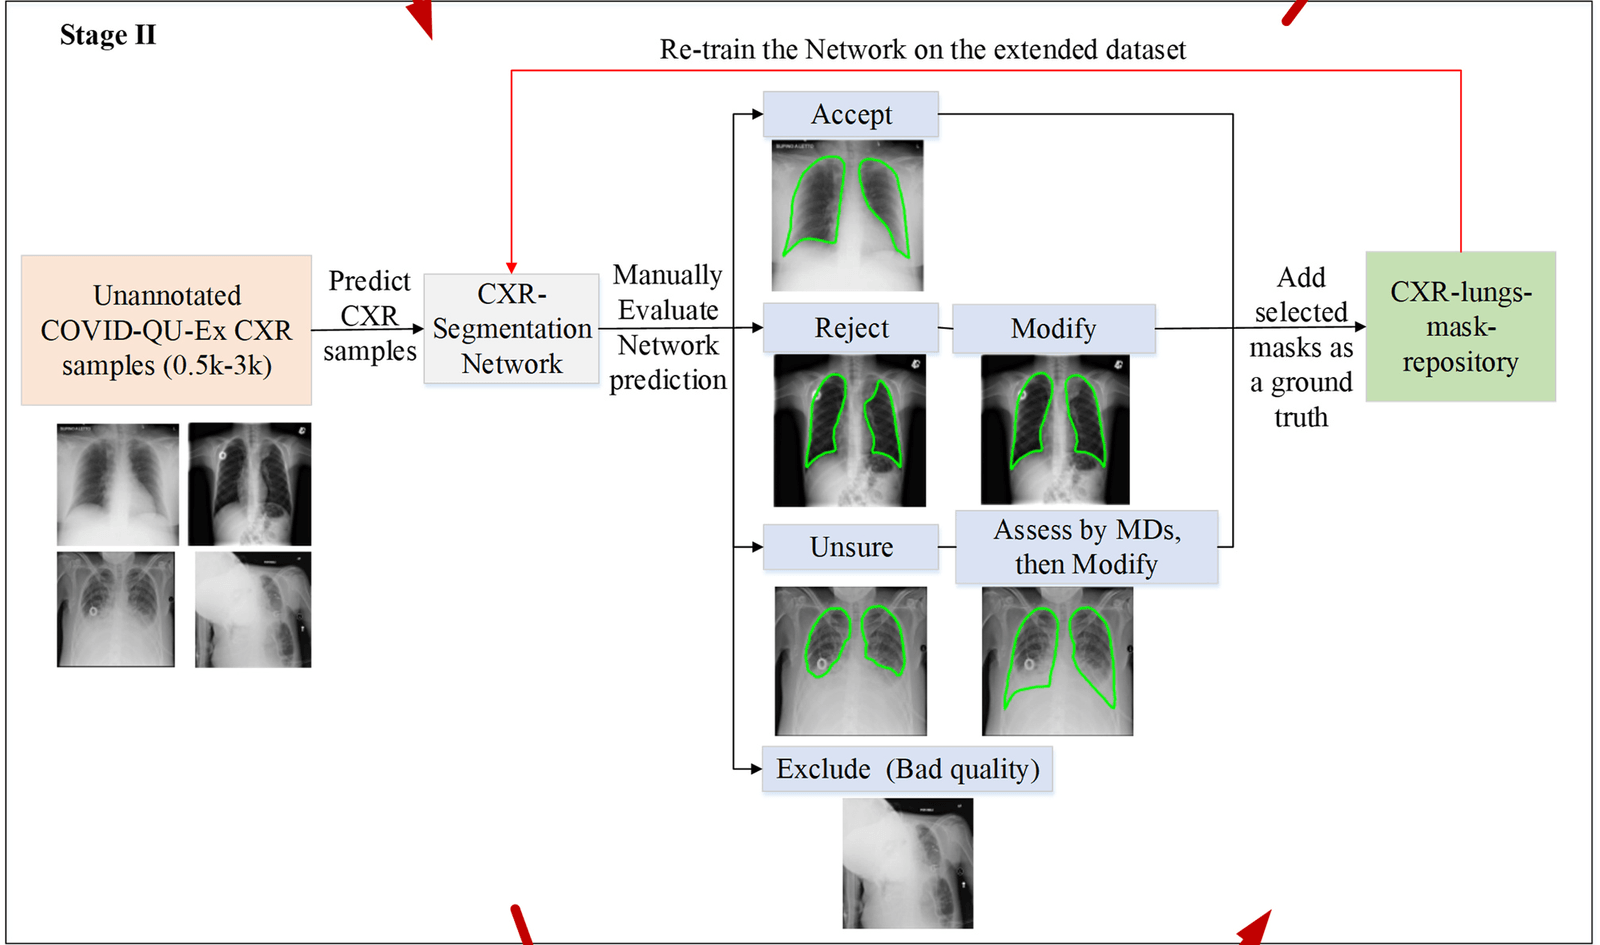
Drawing lung outlines by hand at this scale was not practical, so masks were built through human–machine collaboration. Networks trained on 704 existing masks proposed outlines for a 3,000-image subset. Researchers accepted, corrected, referred or excluded each one, and the network was retrained as the set grew. Six networks trained on those masks then proposed outlines for the remaining 30,920 images, researchers selected among them, and physicians verified the final masks.
- Chest X-rays with lung masks
- 33,920
- COVID-19 images
- 11,956
Localising and quantifying infection on chest X-ray
Computers in Biology and Medicine · 2021
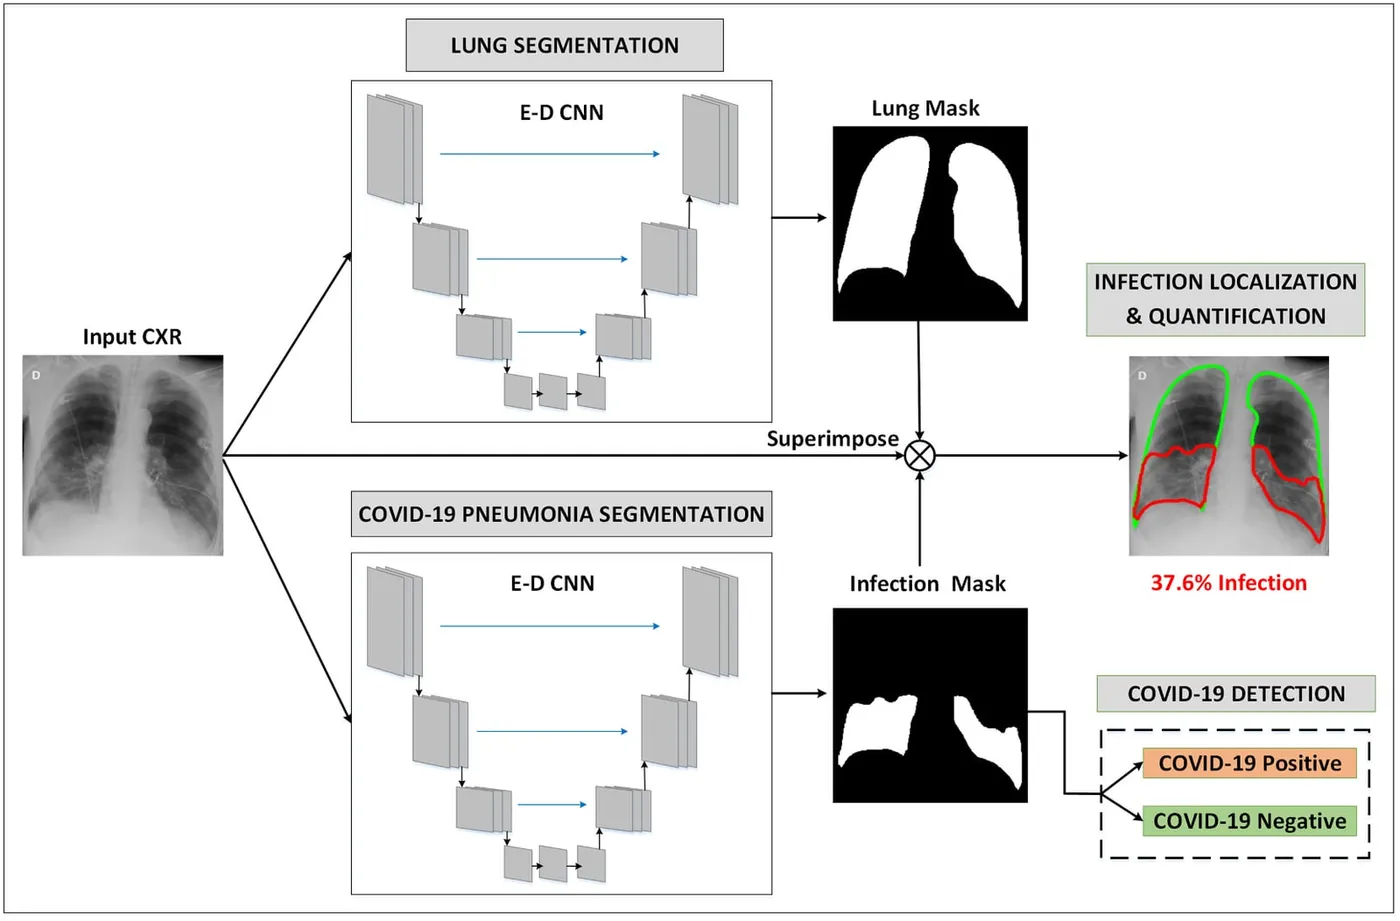
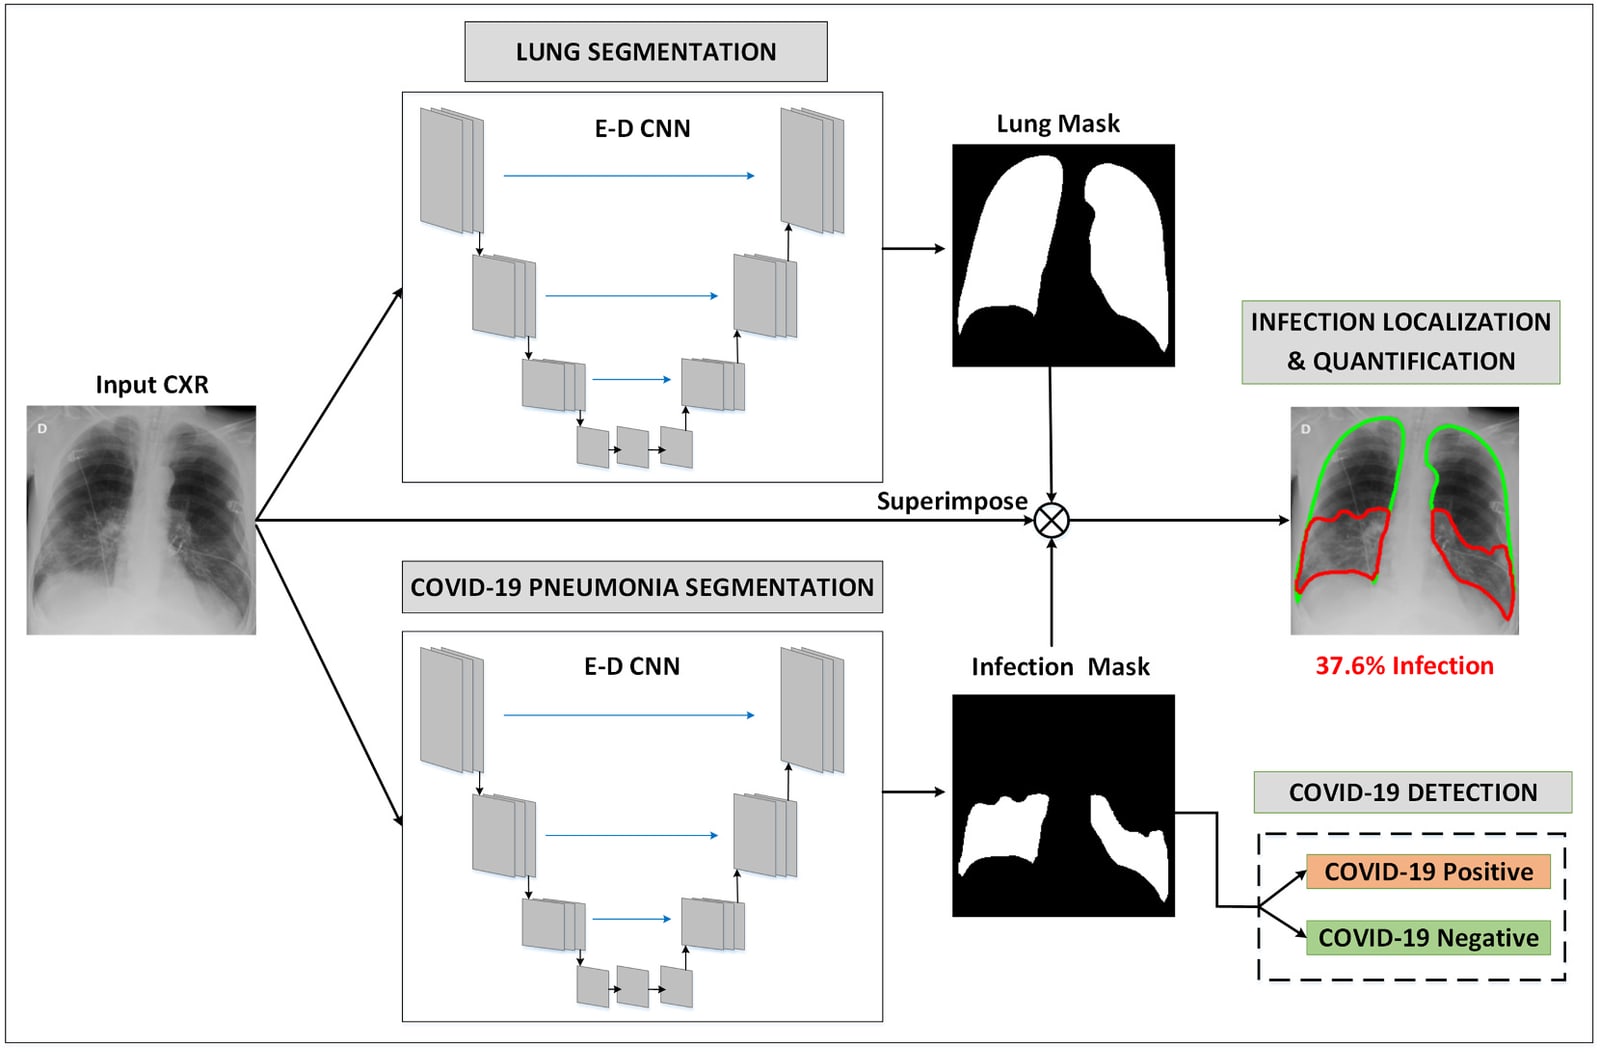
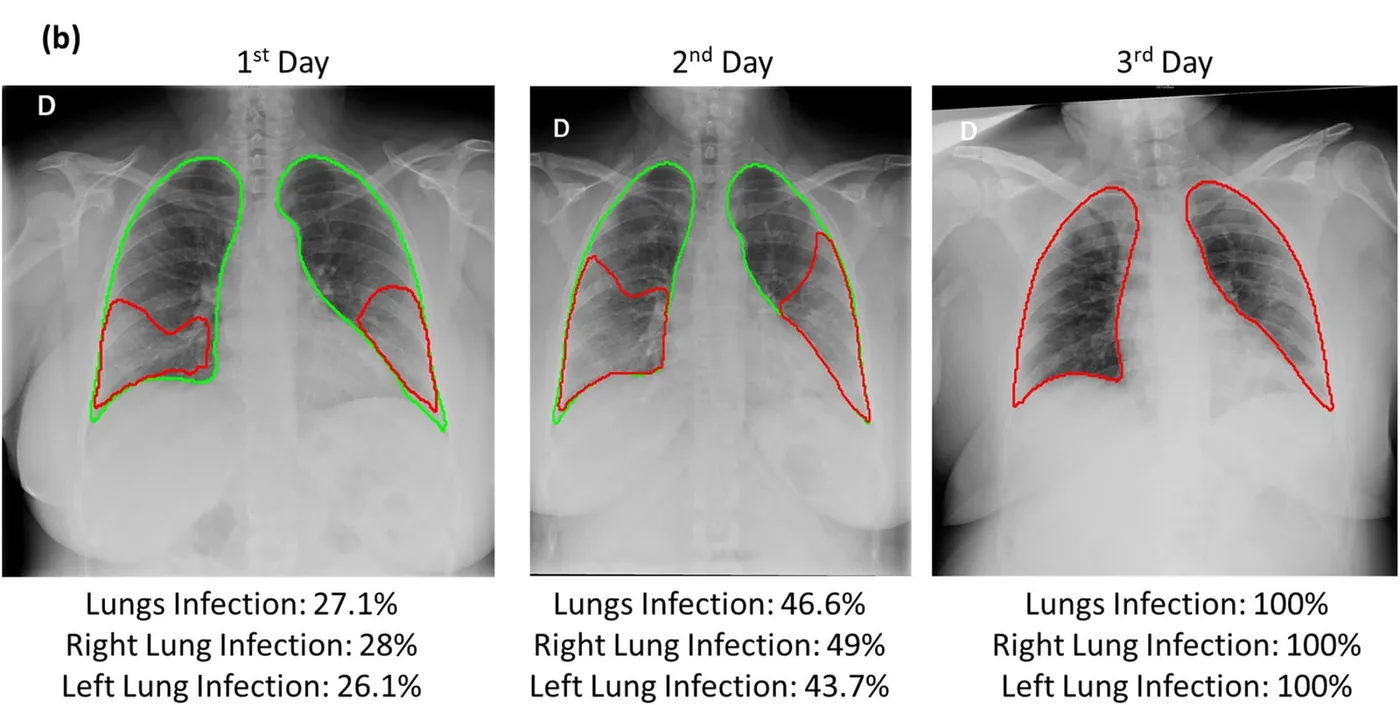
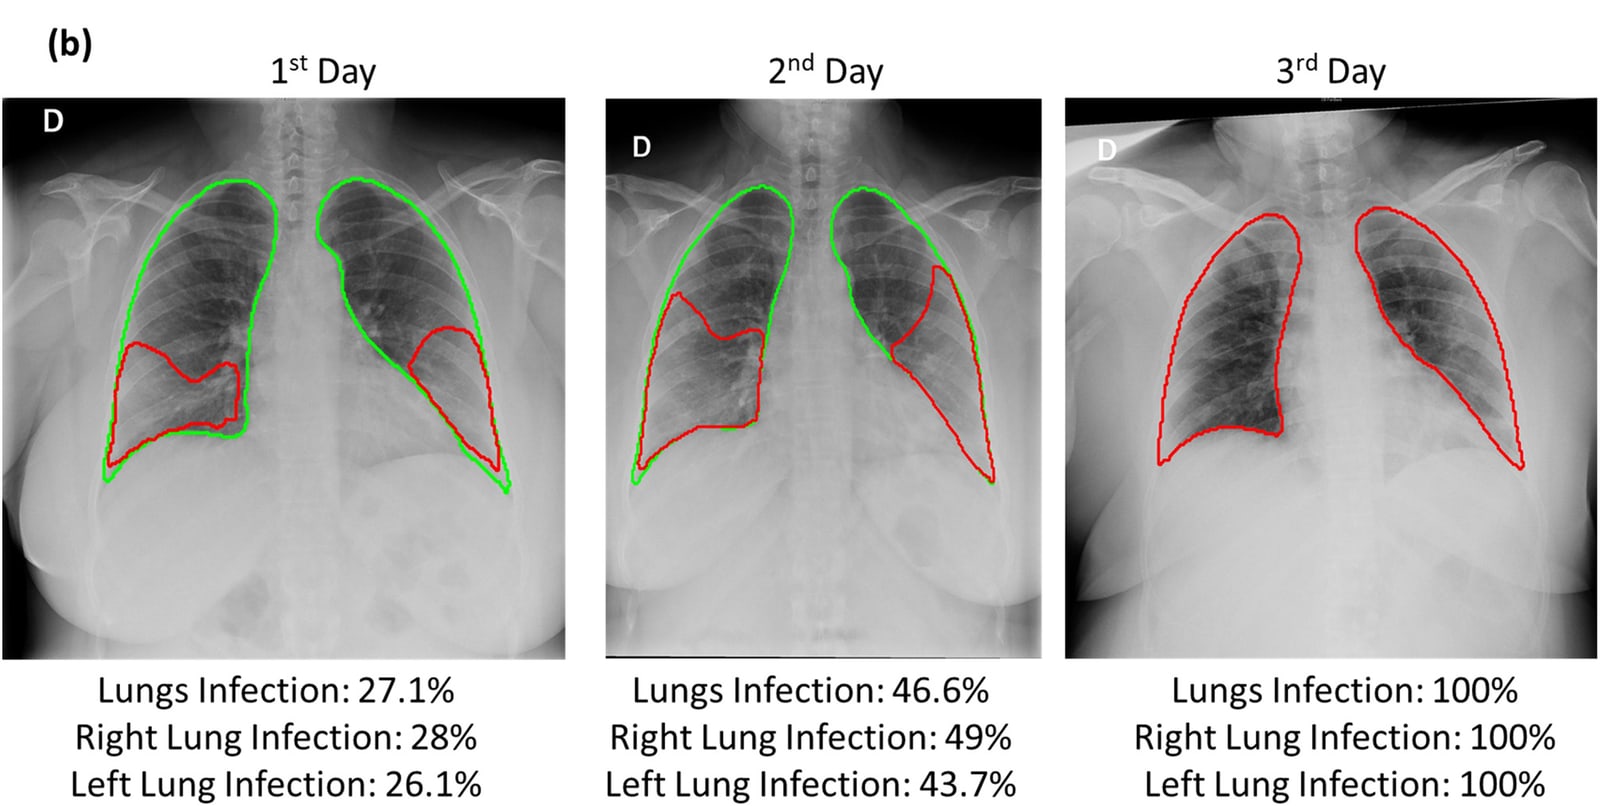
Two networks run in parallel on each X-ray, one for the lungs and one for infection. Overlaying their masks shows where the infection is and what share of each lung it covers, and any predicted infection marks the image as COVID-19 positive. U-Net, U-Net++ and Feature Pyramid Networks were compared with five encoders. Infection models used 2,913 COVID-19 images with expert infection masks from QaTa-Cov19, balanced by the same number of negative images.
Repeating the measurement on a patient’s successive X-rays can follow how the disease progresses, as in the example below.
- Lung segmentation Dice
- 97.99%
- Infection segmentation Dice
- 88.21%
- COVID-19 detection sensitivity (99.14% specificity)
- 99.31%
Separating COVID-19 from other pneumonia
Conference paper · 2022
A follow-on study assembled QU-MLG-COV, a set of 16,712 chest X-rays, and compared 21 pretrained encoders for sorting images into COVID-19, viral pneumonia, bacterial pneumonia and normal. CheXNet gave the best results, with class accuracies of 98.89% for COVID-19, 97.87% for bacterial pneumonia, 97.55% for viral pneumonia and 99.09% for normal images.
- Chest X-rays in QU-MLG-COV
- 16,712
- Pretrained encoders compared
- 21
My contribution
This was one of my earliest research-assistant projects. I contributed substantially to data curation while we assembled the large X-ray benchmark, and to the evaluation and interpretation of the X-ray localisation and severity models. For the CT study I worked on validation, investigation and data curation, and for the pneumonia study on model evaluation and analysis. I also contributed to preparing or reviewing all three manuscripts.
Study scope
These are retrospective studies of public image collections, each with its own annotation protocol and task. X-ray severity was shown as the measured extent of infection, and the CT critical group held only two patients. Clinical use would require prospective validation.
Publications
- COVID-19 infection localization and severity grading from chest X-ray imagesComputers in Biology and Medicine · 2021
- Detection and Severity Classification of COVID-19 in CT Images Using Deep LearningDiagnostics · 2021
- Classification of Viral, Bacterial, And Covid-19 Pneumonia using Deep Learning Framework from Chest X-Ray ImagesSignal, Image Processing and Embedded Systems Trends · 2022
Data
- COVID-QU-Ex DatasetKaggle dataset