Physiological signal processing · 2023–2025
Contactless cardiovascular waveforms from facial video and radar
Using deep learning to reconstruct pulse, ECG and arterial pressure waveforms from facial video and 24 GHz radar, with no sensor touching the body.
Qatar University High Impact Grant QUHI-CENG-23/24-216 · Prince Sattam Bin Abdulaziz University project PSAU/2024/R/1445
Approach
Can deep learning recover pulse, ECG and arterial pressure waveforms from a camera or radar, with no sensor touching the body?
Continuous cardiovascular monitoring usually depends on finger sensors, adhesive electrodes, cuffs or arterial lines. These can irritate the skin, restrict movement or suit only clinical settings. This work trains one-dimensional encoder–decoder networks to turn a contactless recording into a reference waveform captured at the same time, then tests them on people held out from training. It began with the optical pulse from facial video and moved to radar, first for ECG and then for arterial pressure.
- Record facial video or radar
- Reconstruct the waveform with a 1D network
- Compare with reference sensors
Recovering the pulse waveform from facial video
Biomedical Signal Processing and Control · 2024 (online 2023)
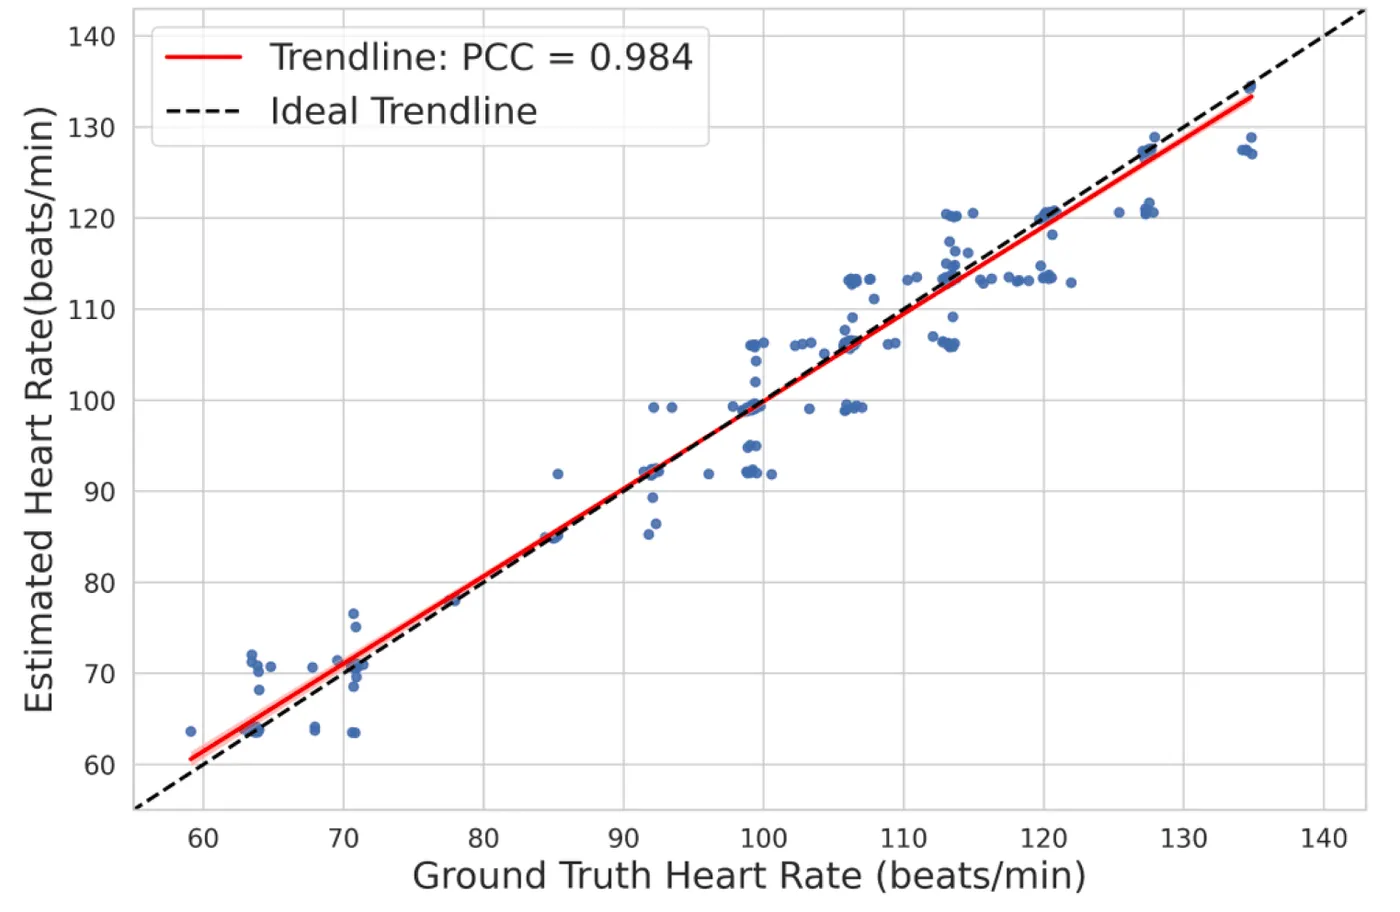
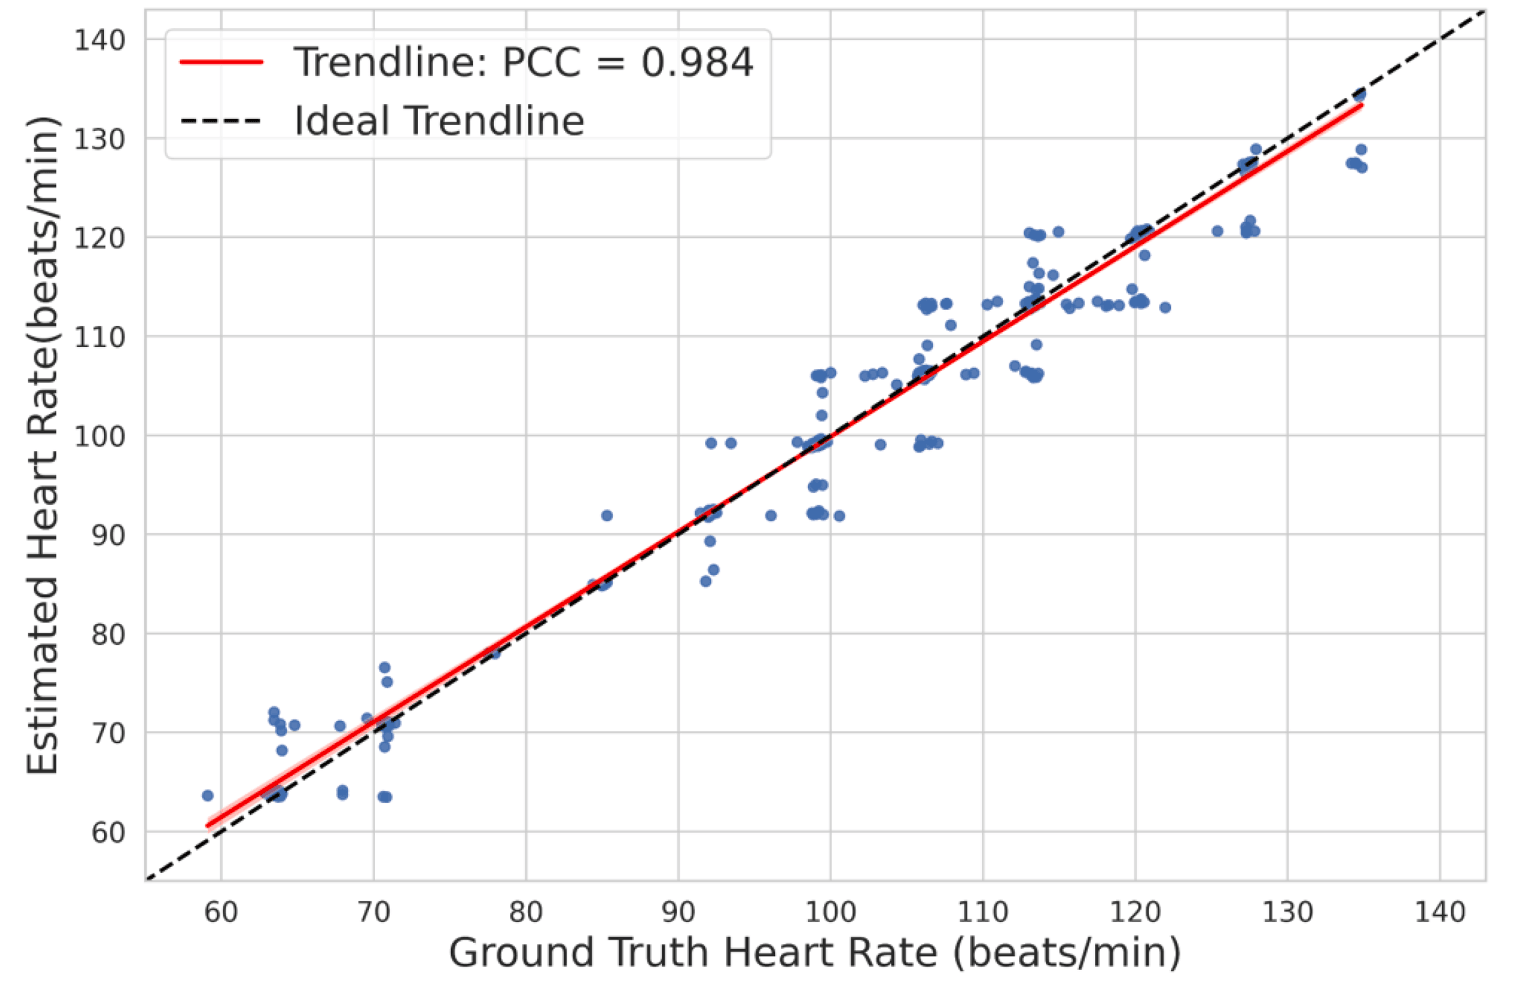
Remote photoplethysmography (rPPG) reads the slight skin-colour changes caused by blood flow. It could stand in for a finger sensor when contact is unsuitable, for example with burns, premature babies or sensitive skin. Most earlier studies reported only heart rate. This one also measured how closely the recovered waveform matched a finger sensor.
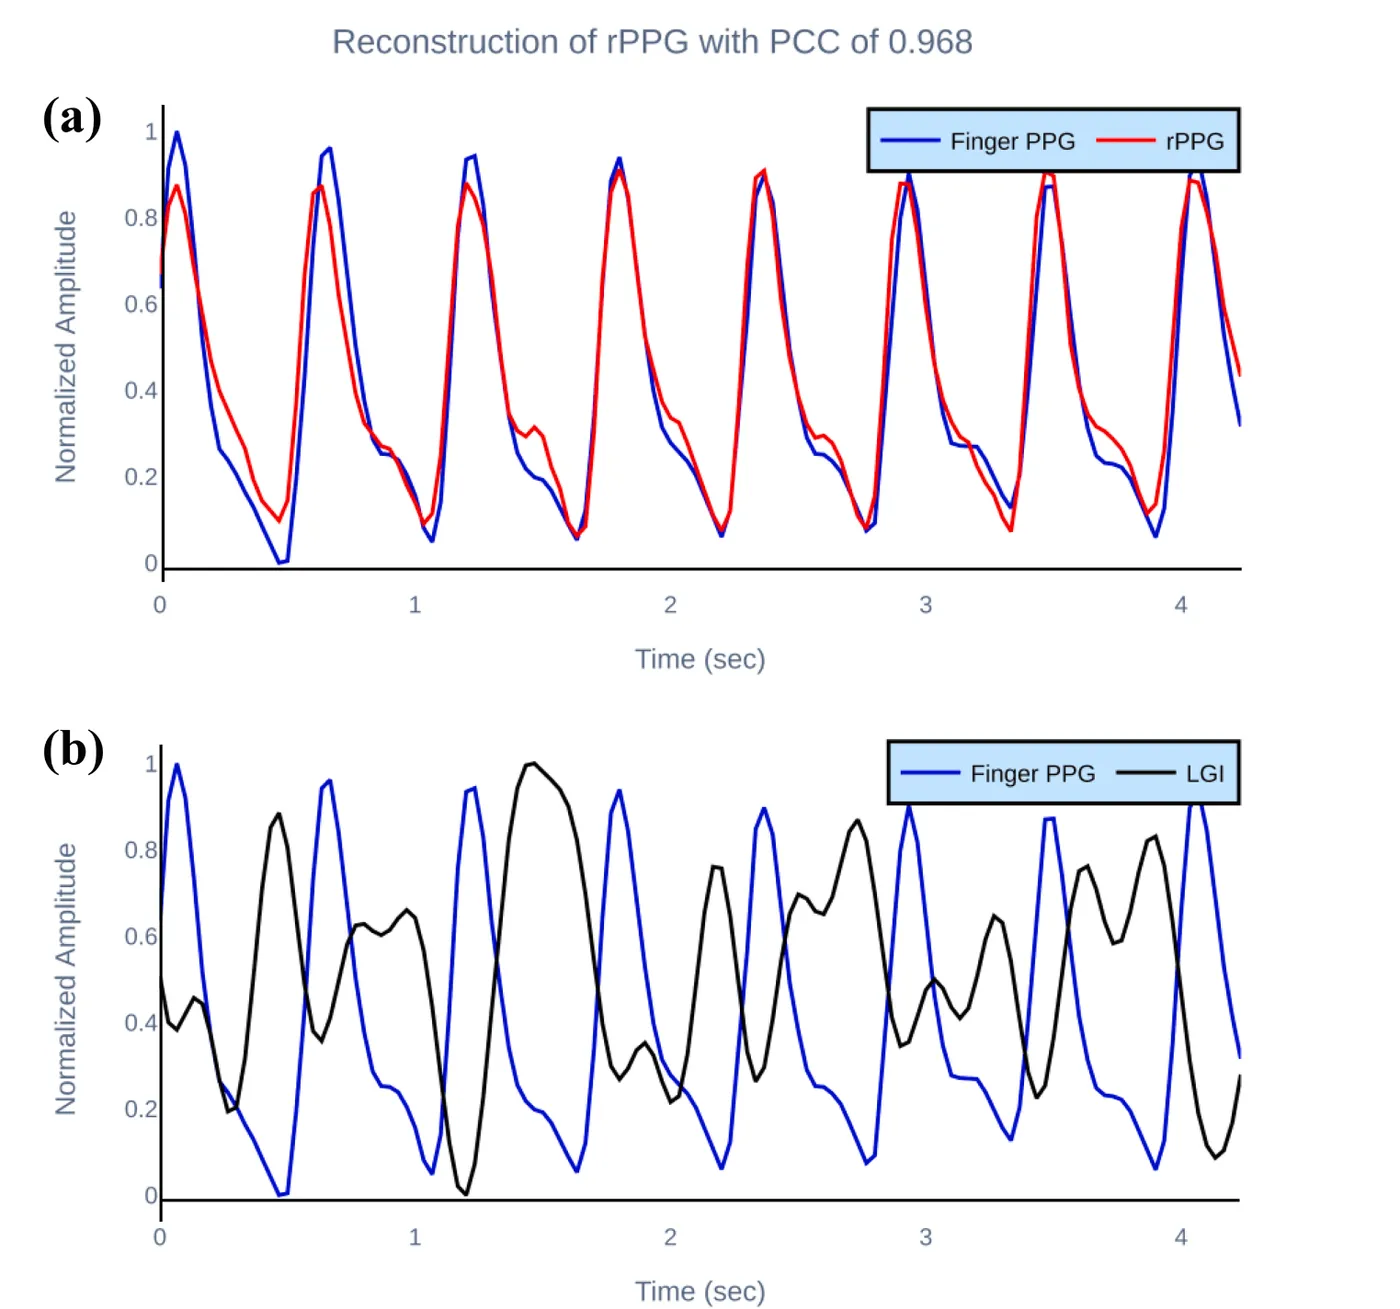
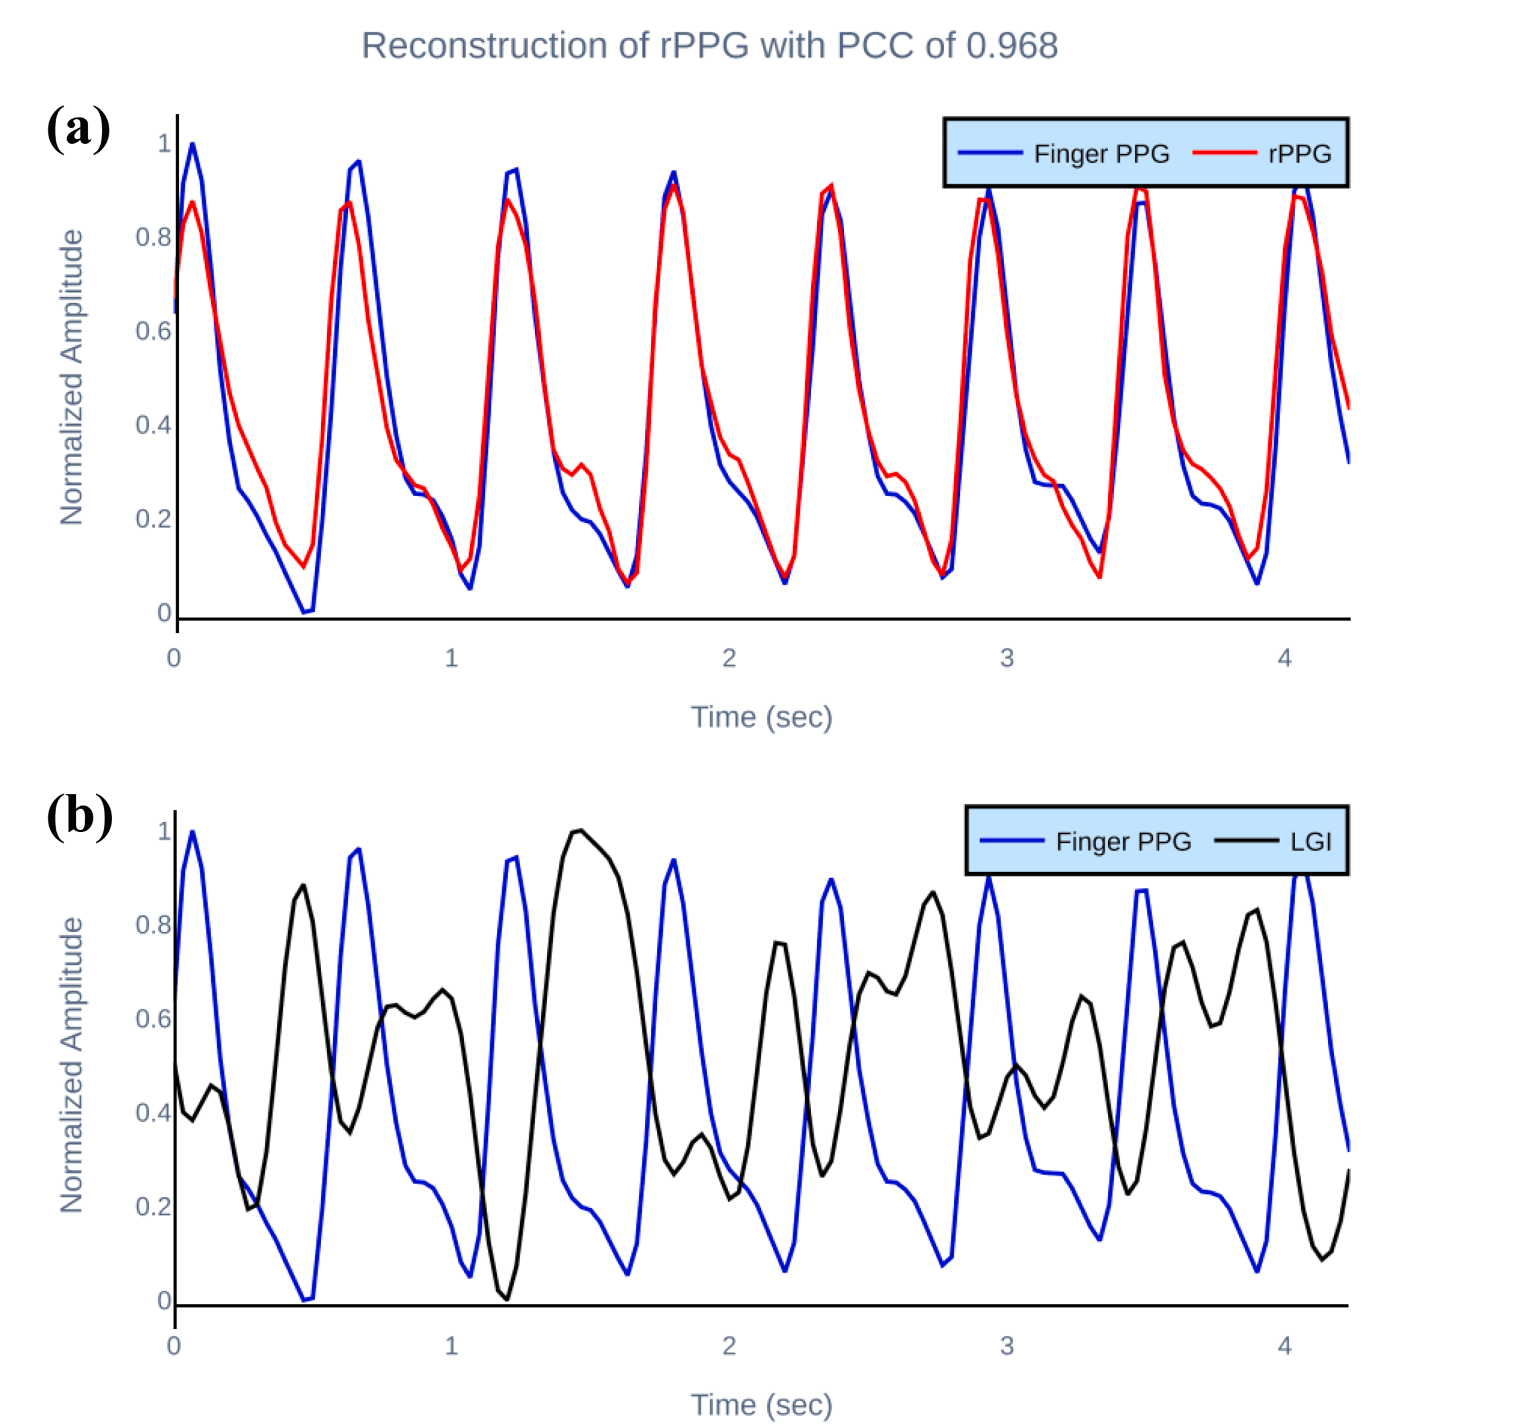
The study used UBFC-RPPG, with one-minute webcam videos of 42 people playing a timed maths game and a finger pulse oximeter as the reference. Faces were detected, skin was segmented and the Local Group Invariance (LGI) method produced an initial pulse signal. LGI-rPPG-Net, a shallow encoder–decoder, then refined it. Training, validation and test sets contained 26, 8 and 8 different people.
Three levels, 128 starting filters and a kernel size of 7 gave the best result, and a deeper network performed worse. Reconstruction reduced the waveform error from 0.492 for the LGI input to 0.148. LGI was also the strongest input, ahead of CHROM (correlation 0.801), POS (0.759) and the green channel alone (0.711). Performance fell on PURE, an independent dataset the model had not seen.
- Waveform correlation with finger PPG
- 0.862
- Heart-rate correlation
- 0.984
- Heart-rate mean absolute error
- 1.51 bpm
| UBFC-RPPG test set | PURE external test | |
|---|---|---|
| Waveform correlation | 0.862 | 0.70 |
| Waveform RMSE | 0.148 | 0.202 |
| Dynamic time warping distance | 0.699 | 0.901 |
| Heart-rate correlation | 0.984 | 0.77 |
| Heart-rate RMSE | 2.91 bpm | 16.36 bpm |
| Heart-rate mean absolute error | 1.51 bpm | 8.83 bpm |
Generating ECG waveforms from radar
Computers in Biology and Medicine · 2024
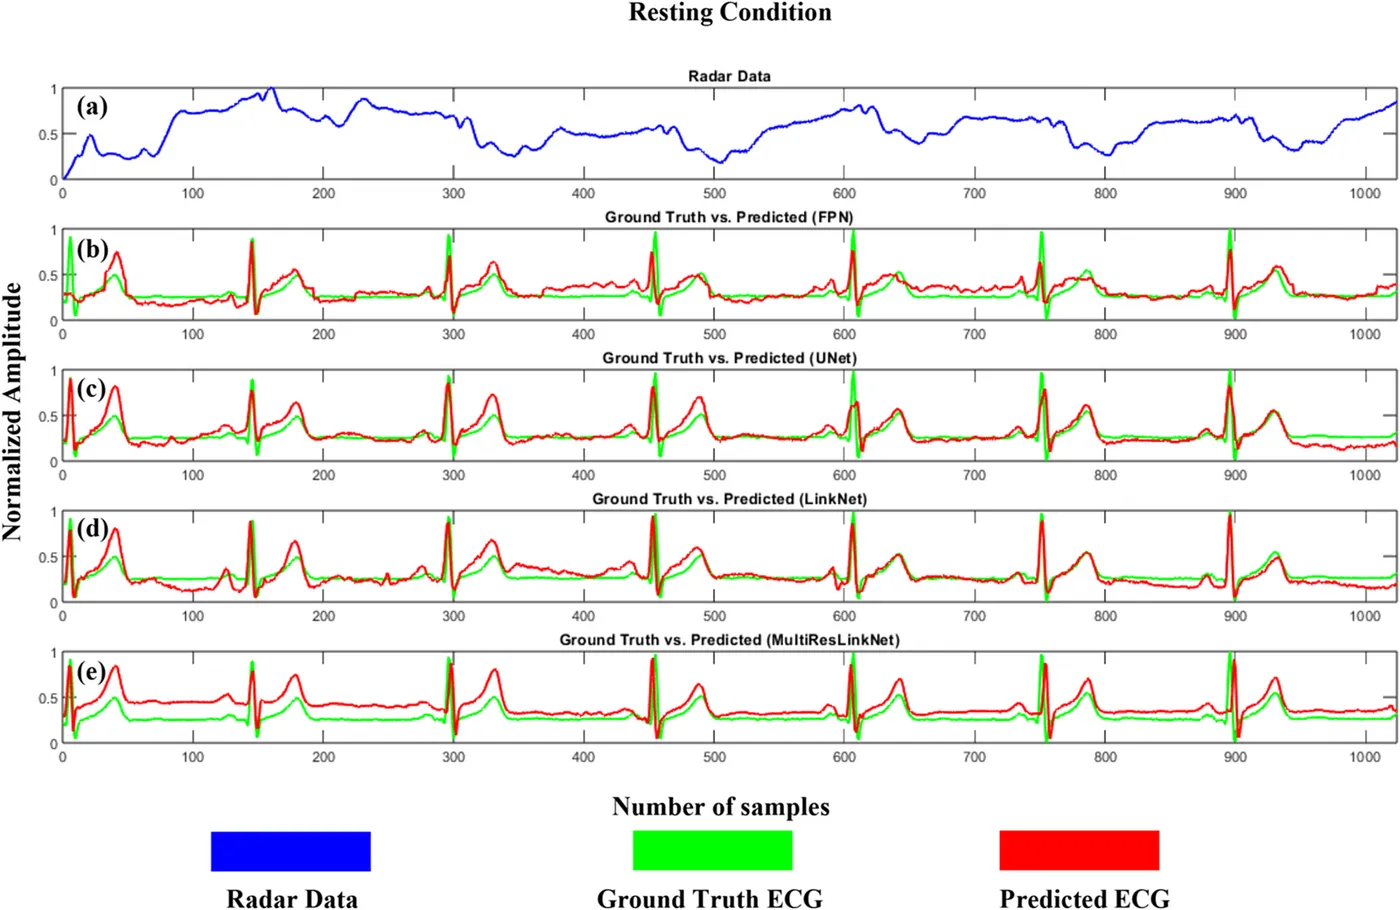
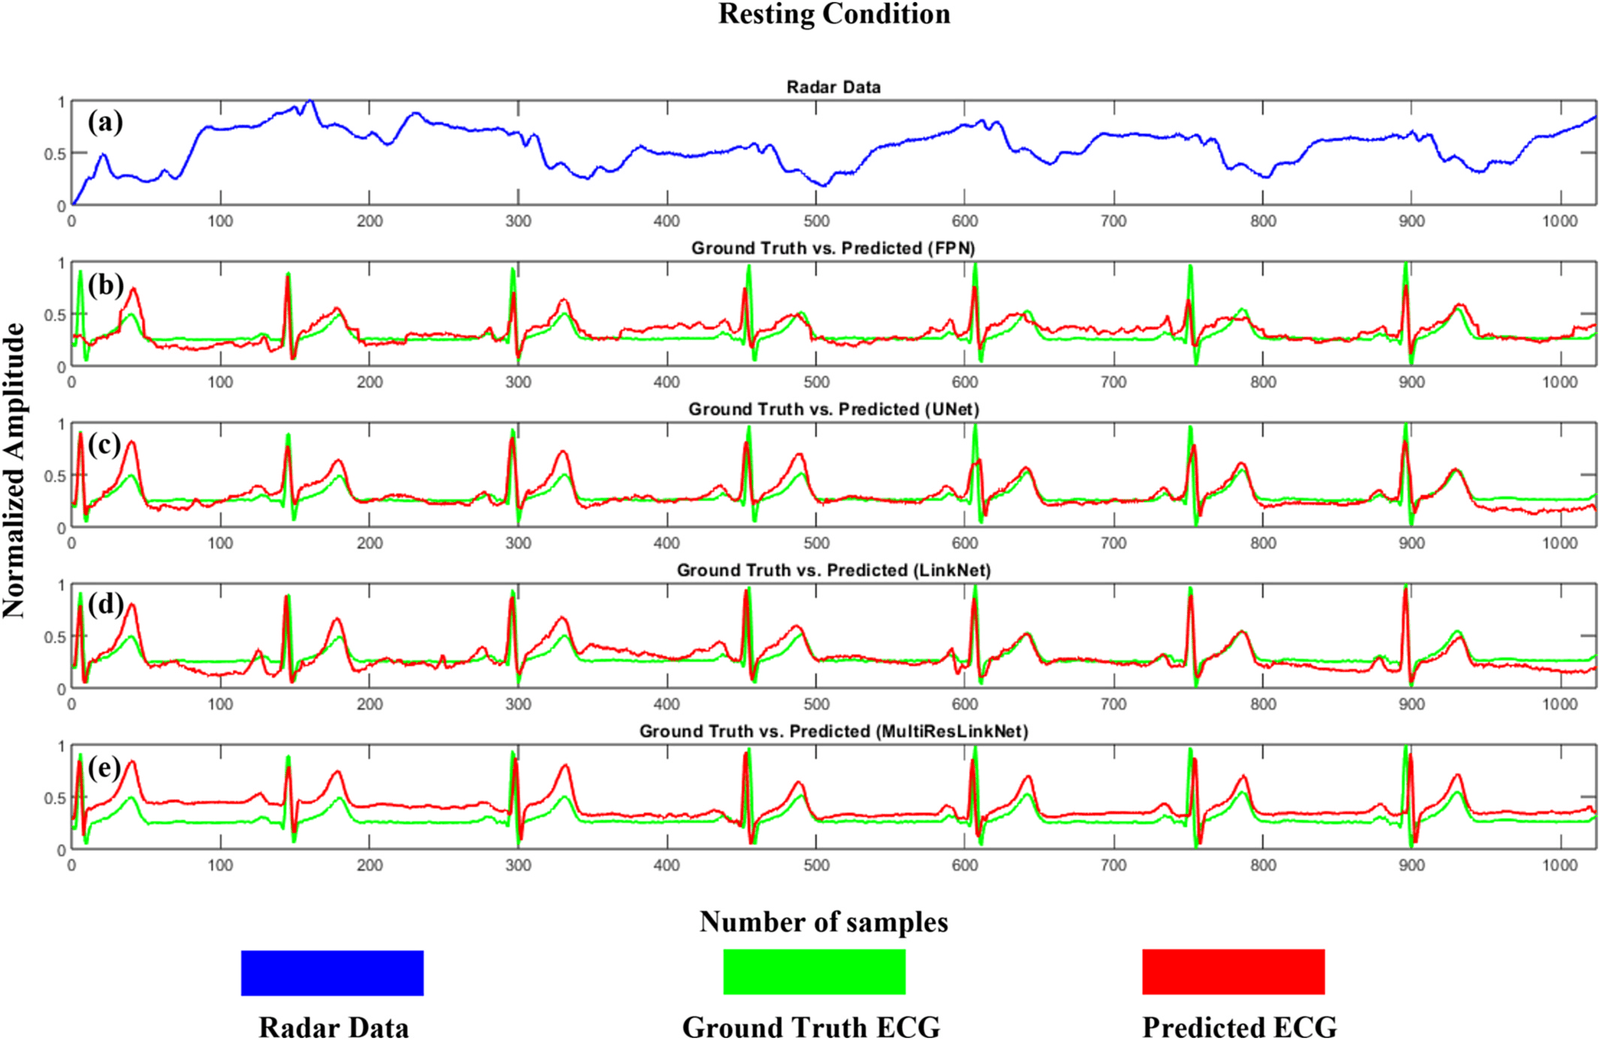
Radar can sense small chest movements from a distance, but earlier Doppler methods mainly estimated heart rate or beat intervals. They did not recover the P wave, QRS complex and T wave that make up an ECG. This study used a public dataset from a 24 GHz six-port radar with synchronised clinical ECG, recorded from healthy adults at rest (30 people), during the Valsalva manoeuvre (27) and during apnoea (24).
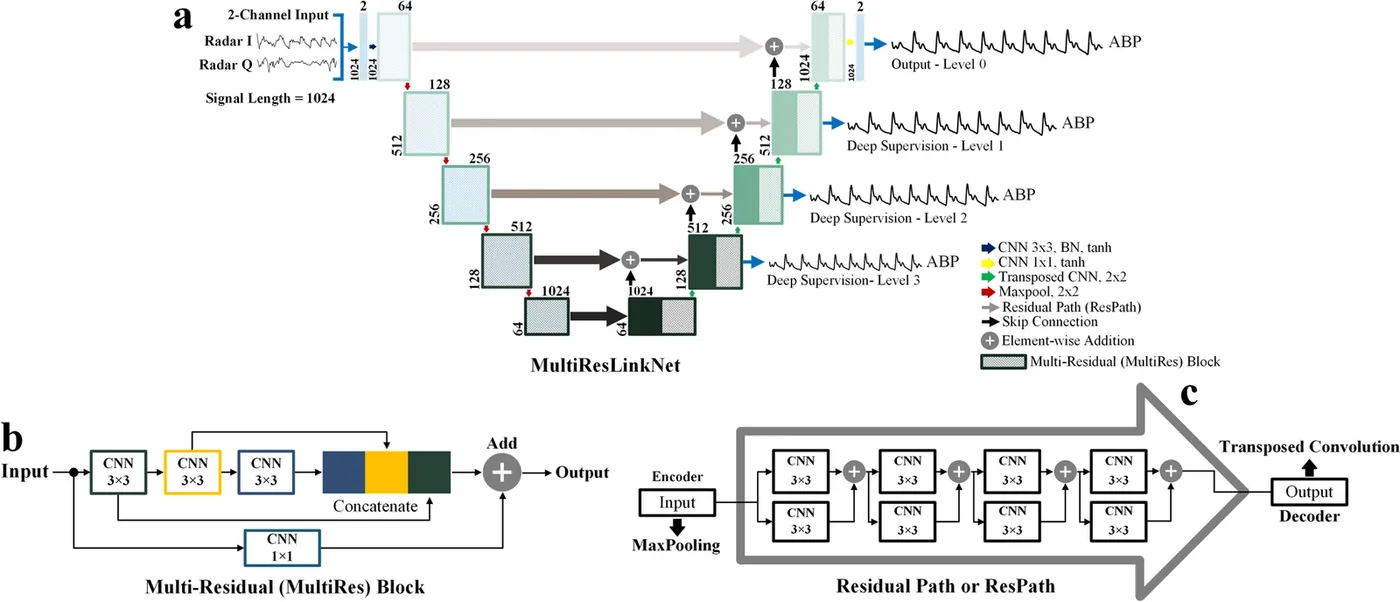
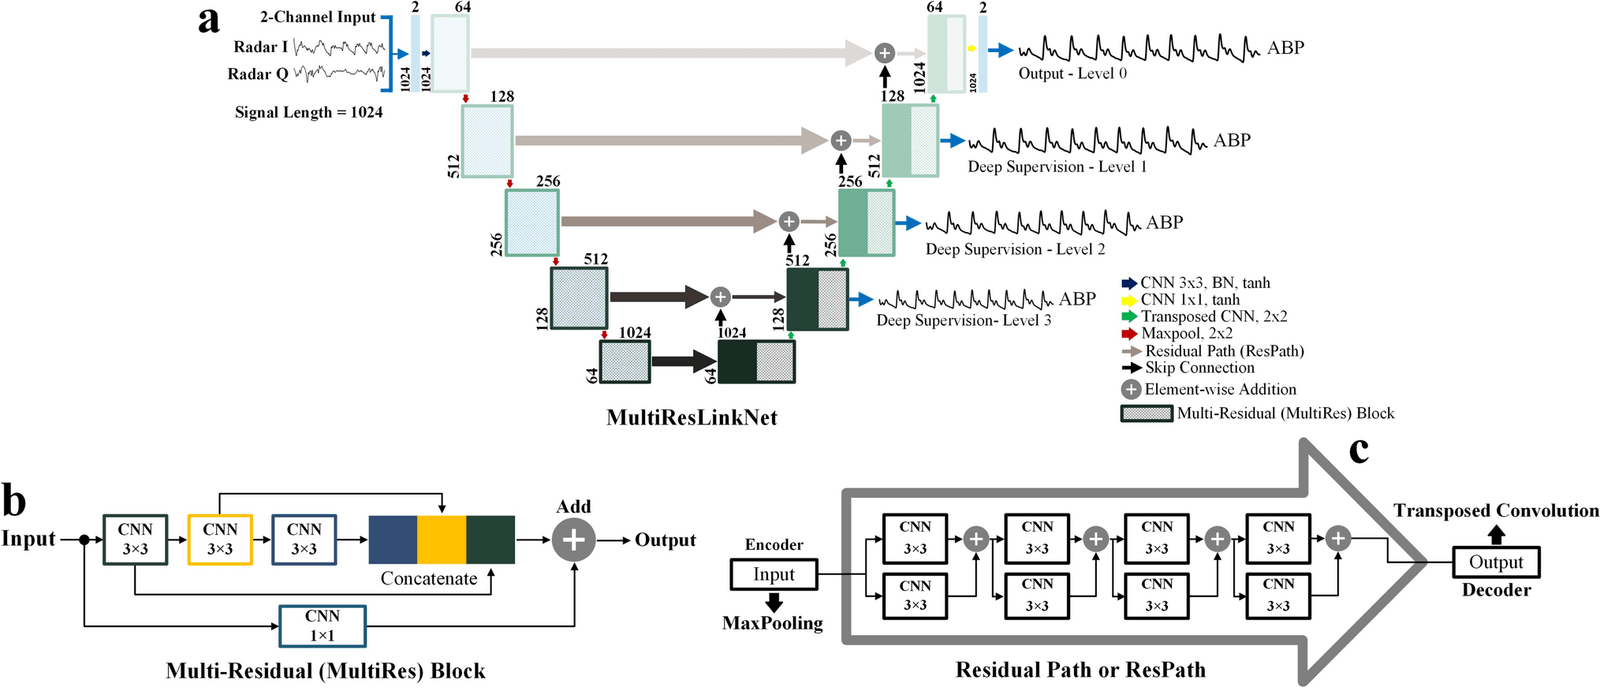
MultiResLinkNet builds on LinkNet, with multiresolution blocks, residual paths between encoder and decoder, and deep supervision. It took a single radar channel derived from the in-phase and quadrature signals. FPN, UNet and LinkNet of matched size served as comparisons, with five-fold cross-validation on separate people, for each condition and for all three combined.
MultiResLinkNet had the highest spectral correlation in every setting, and the highest temporal correlation except during apnoea. FPN had the lowest absolute and squared error on the combined data. Mean heart rate from the generated ECG was within 2 beats per minute of the reference in each condition. Beat-to-beat variability was less faithful, with RMSSD about 1.8 to 2.4 times the reference value.
- Spectral correlation, three conditions combined
- 79.96%
- Temporal correlation, three conditions combined
- 61.86%
- R-peak detection F1 score, combined
- 0.939
| Temporal correlation | Spectral correlation | Best other network (temporal / spectral) | R-peak F1 | |
|---|---|---|---|---|
| Rest | 66.10% | 82.44% | 64.35% / 74.68% | 0.955 |
| Valsalva | 60.14% | 77.05% | 58.38% / 68.79% | 0.944 |
| Apnoea | 55.33% | 74.66% | 56.22% / 70.35% | 0.888 |
| All three combined | 61.86% | 79.96% | 59.63% / 70.91% | 0.939 |
Reconstructing arterial pressure waveforms from raw radar
Neural Computing and Applications · 2025
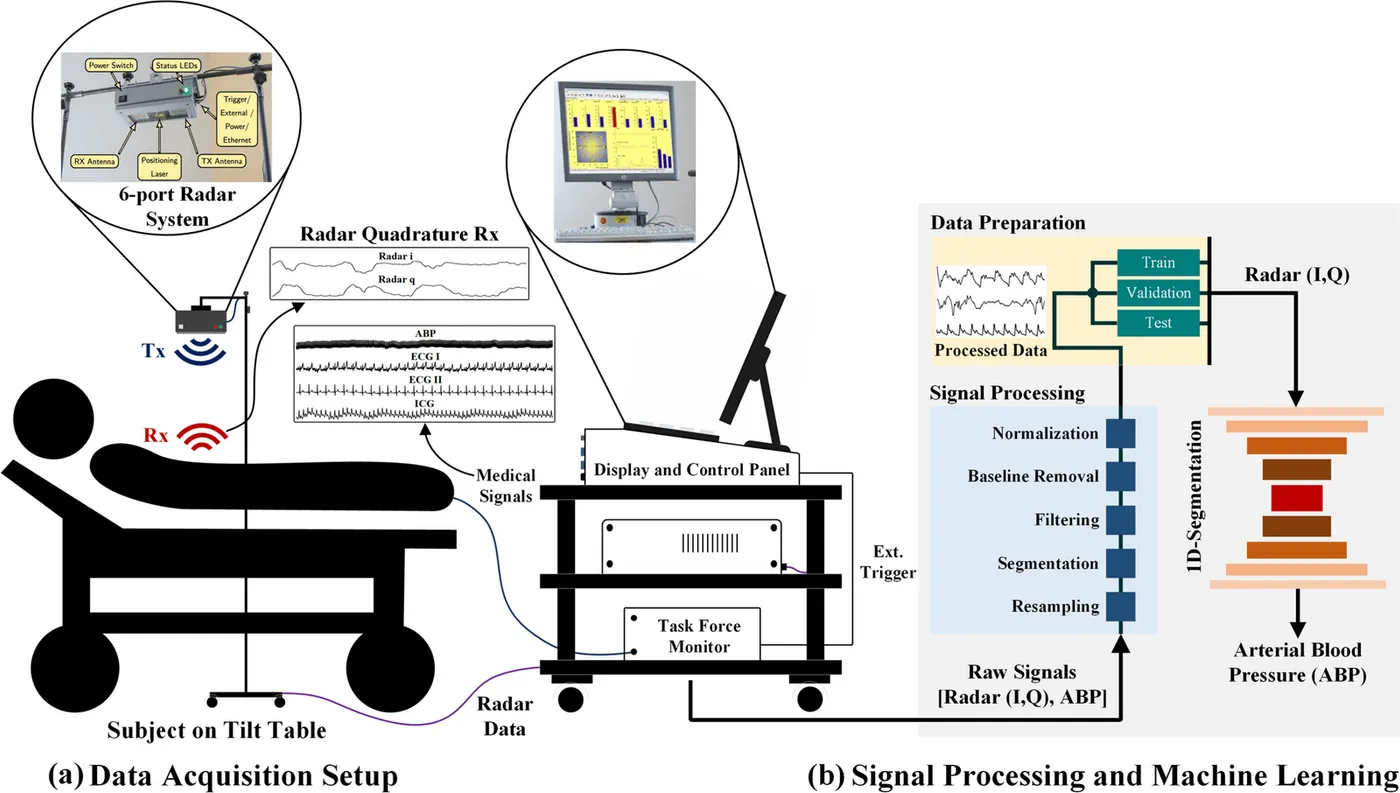
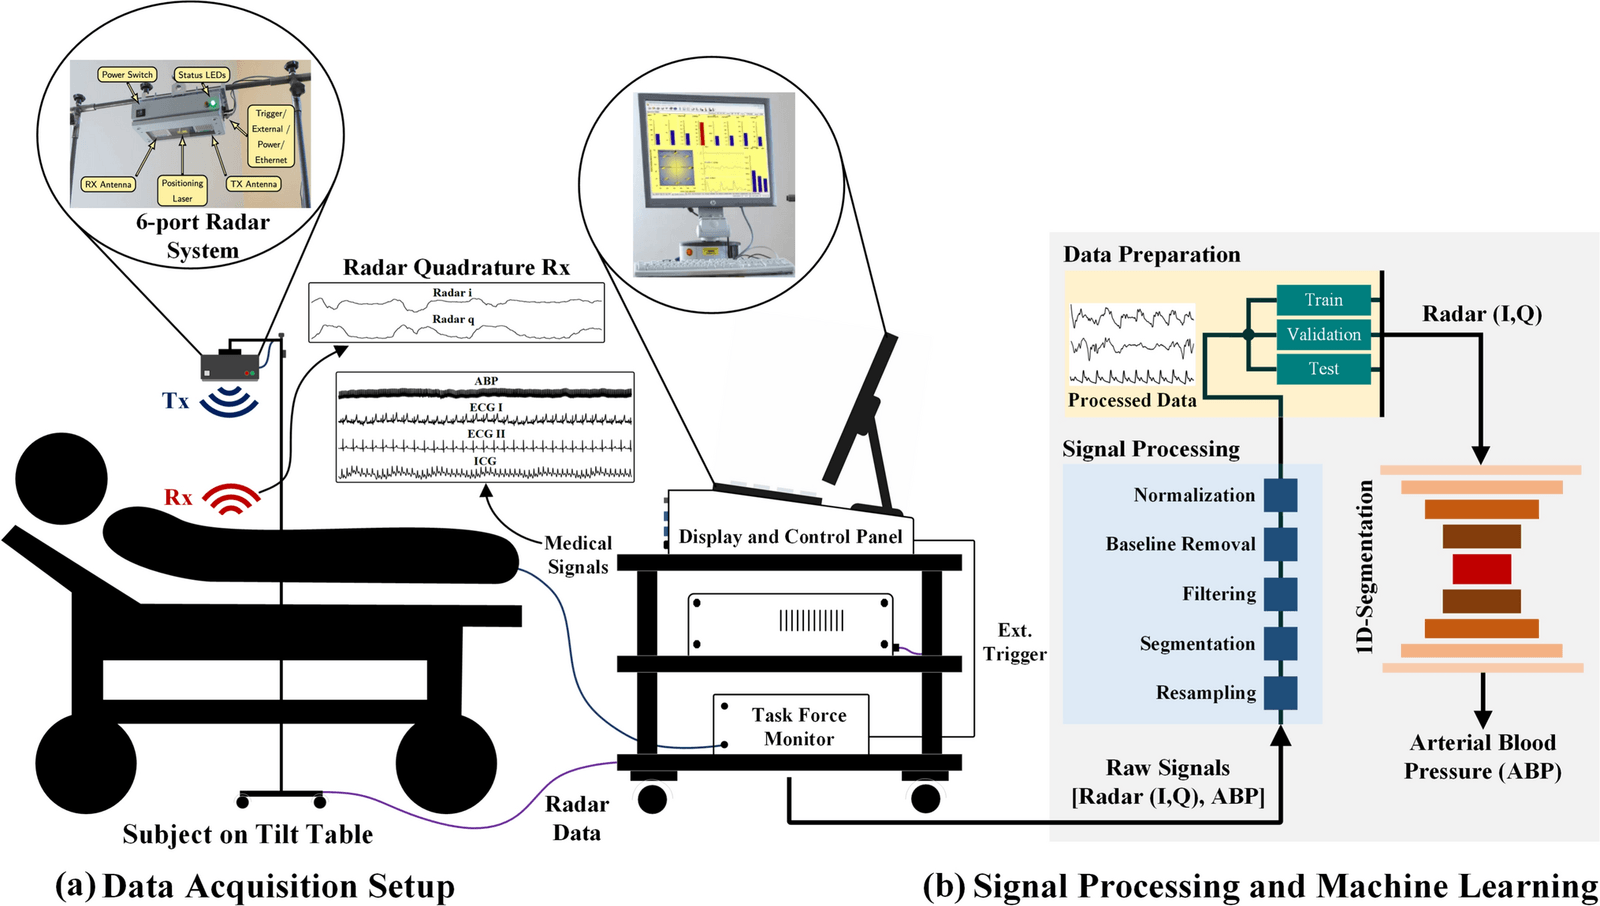
Cuffs give intermittent readings, and continuous clinical monitoring usually relies on an arterial catheter. This study returned to the same radar dataset and added tilt-up and tilt-down to rest, Valsalva and apnoea. Raw in-phase and quadrature signals went directly into a two-channel network, with continuous arterial pressure from a Task Force Monitor as the reference.
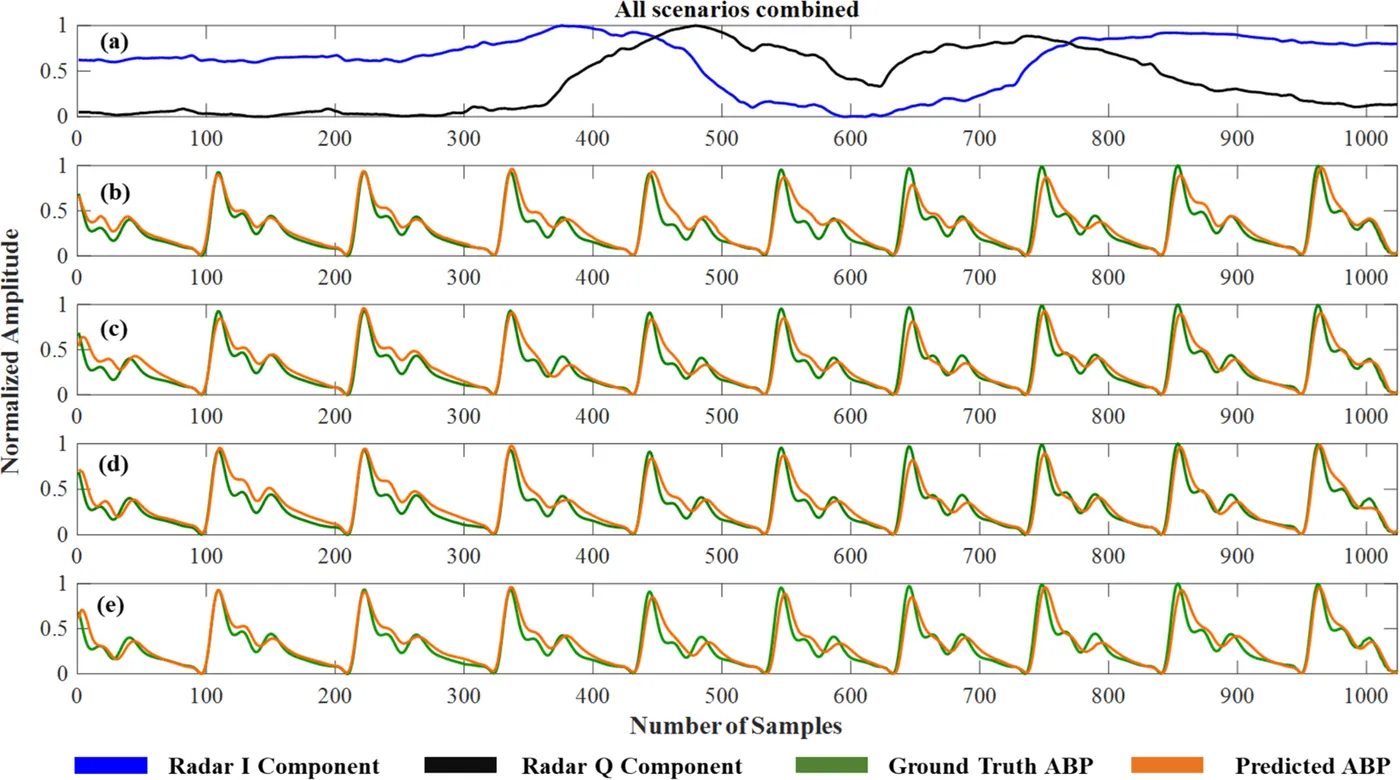
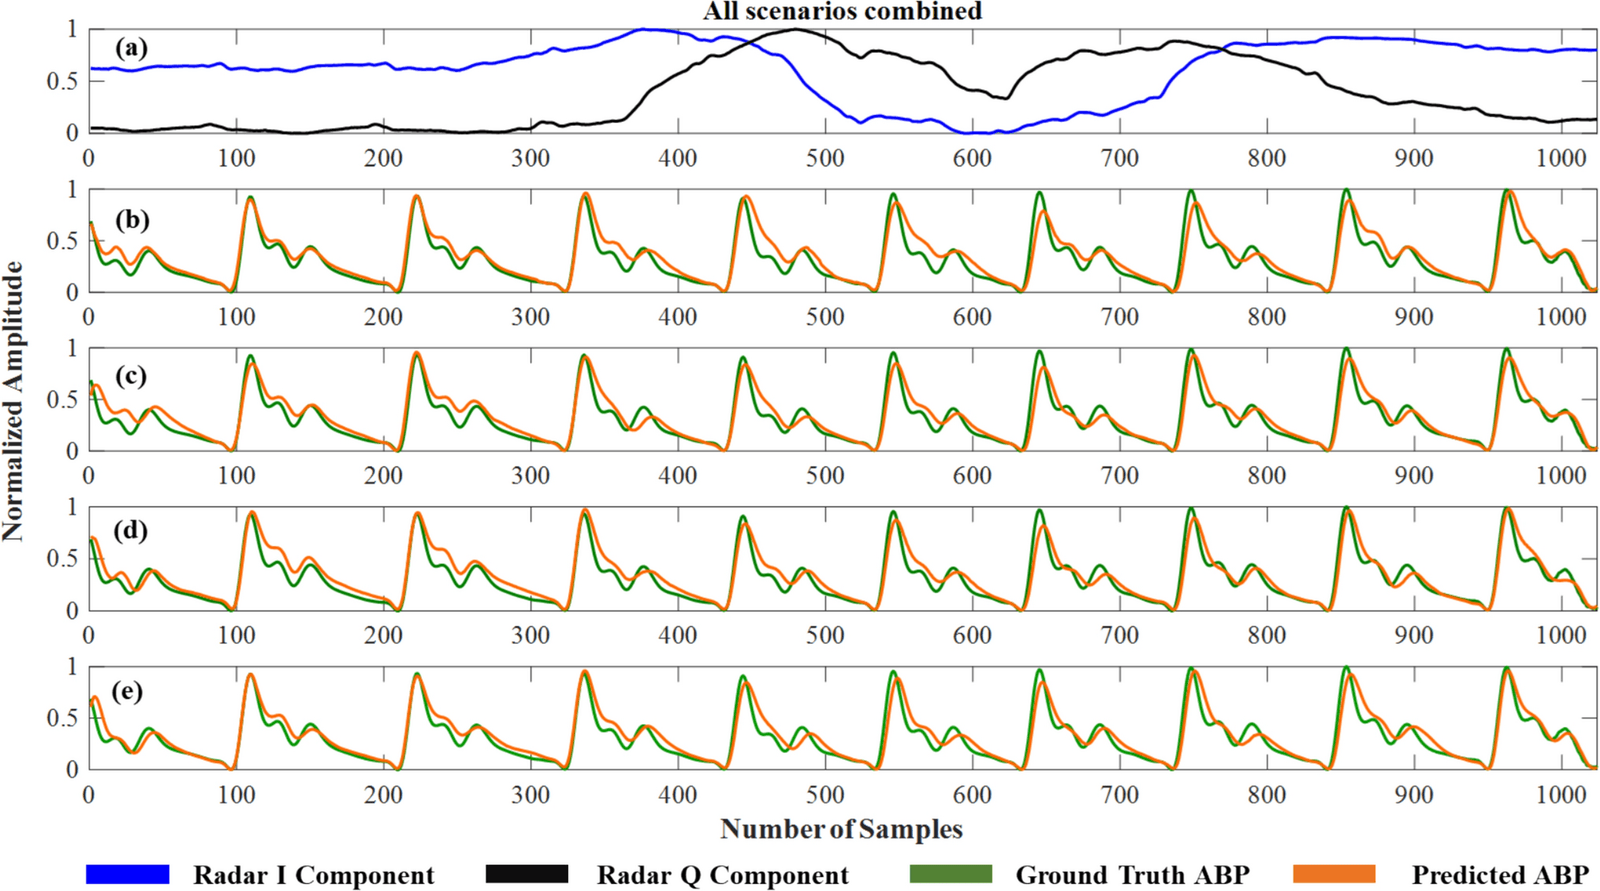
Signals were resampled to 125 Hz and split into 1,024-sample segments. MultiResLinkNet was again compared with FPN, UNet and LinkNet using five-fold cross-validation on separate people. It led on every measure at rest, during Valsalva and during tilt-up, and had the highest correlations when all five conditions were combined. UNet and LinkNet were stronger during apnoea and had slightly higher correlations during tilt-down.
Agreement was much higher than for radar ECG from the same dataset, at 90.09% against 66.10% temporal correlation at rest. The two studies used different radar inputs and did not test the reason directly. The output is a normalised waveform, so it describes the shape of the pressure pulse and not systolic or diastolic values in mmHg.
- Temporal correlation, five conditions combined
- 85.05%
- Spectral correlation, five conditions combined
- 93.99%
- Temporal correlation at rest
- 90.09%
| Temporal correlation | Spectral correlation | Best other network (temporal / spectral) | |
|---|---|---|---|
| Rest | 90.09% | 96.61% | 89.18% / 96.25% |
| Valsalva | 86.20% | 94.09% | 84.31% / 93.27% |
| Apnoea | 71.99% | 86.58% | 79.35% / 91.32% |
| Tilt-up | 71.74% | 87.35% | 70.78% / 86.49% |
| Tilt-down | 86.32% | 94.48% | 86.76% / 94.88% |
| All five combined | 85.05% | 93.99% | 84.82% / 93.91% |
My contribution
For the facial video study, I prepared the deep learning pipeline, contributed to data preprocessing and to video and signal analysis, and supported evaluation, validation and manuscript preparation. For radar ECG, I contributed to the methodology, model development, quantitative evaluation and original draft. For radar arterial pressure, I first proposed exploring one-dimensional reconstruction from raw radar signals, then contributed to the methodology, model implementation, evaluation, interpretation and manuscript review.
Study scope
Both radar studies used one public dataset of 30 healthy adults recorded in a controlled clinical setup. Their outputs are normalised waveforms, so they do not provide calibrated blood pressure or a diagnostic ECG. The video model was trained on 26 people and lost accuracy on an independent dataset. Larger and more varied cohorts, including patients, are needed before clinical use.
Publications
- Deep learning-based beat-to-beat arterial blood pressure estimation using distant radar signalsNeural Computing and Applications · 2025
- ECG waveform generation from radar signals: A deep learning perspectiveComputers in Biology and Medicine · 2024
- LGI-rPPG-Net: A shallow encoder-decoder model for rPPG signal estimation from facial video streamsBiomedical Signal Processing and Control · 2024