Applied machine learning · 2021
Satellite image segmentation for climate and geopolitical risk
A multiclass segmentation pipeline that maps buildings, vegetation, water and other classes from satellite images, built for a team project on risks to water and energy financing in West and Central Africa.
Omdena AI challenge · Project partner Finz · Completed team project
Approach
Can deep segmentation models map buildings, vegetation and water from satellite images well enough to add local detail to climate and geopolitical risk scores?
Finz helps governments, banks and foundations finance small water and energy units in urban and rural areas. In this eight-week Omdena challenge, an international team studied how climate hazards and geopolitical events threaten such assets in Togo, northern Côte d’Ivoire and Cameroon. The team built a flood risk map for Togo and a geopolitical risk score from historical conflict events. My task added a satellite-image pipeline to map buildings, vegetation and water around a site.
- Select and prepare satellite data
- Train and compare U-Net models
- Test on Sentinel-2 images
Choosing a labelled satellite dataset
Task lead · July 2021
The pipeline needed satellite images labelled with several classes at once, so that one model could map buildings, roads, vegetation and water around a site. About 30 public aerial and satellite datasets were compared by size, platform, number and resolution of images, label type and classes. Many covered a single class, such as buildings, ships or trees, or came from drones.
Five datasets were shortlisted, and the Dstl Satellite Imagery Feature Detection dataset fitted best. Its WorldView-3 scenes each cover 1 km × 1 km and come as RGB images and as 16-band images, with eight multispectral bands from 400 to 1,040 nm and eight short-wave infrared bands from 1,195 to 2,365 nm. Ten classes are labelled as polygons.
- Datasets compared
- About 30
- Labelled classes
- 10
- Spectral bands per image
- 16
| Classes and what they include | |
|---|---|
| Buildings and structures | Residential, non-residential and large buildings, fuel storage and fortified buildings, plus other man-made structures |
| Transport routes | Roads, and tracks such as dirt tracks and footpaths |
| Vegetation | Trees, from woodland to single trees, and crops, including grain and row crops |
| Water | Waterways and standing water |
| Vehicles | Large vehicles such as lorries and buses, and small vehicles such as cars and motorbikes |
Building an end-to-end segmentation pipeline
Task lead · August 2021
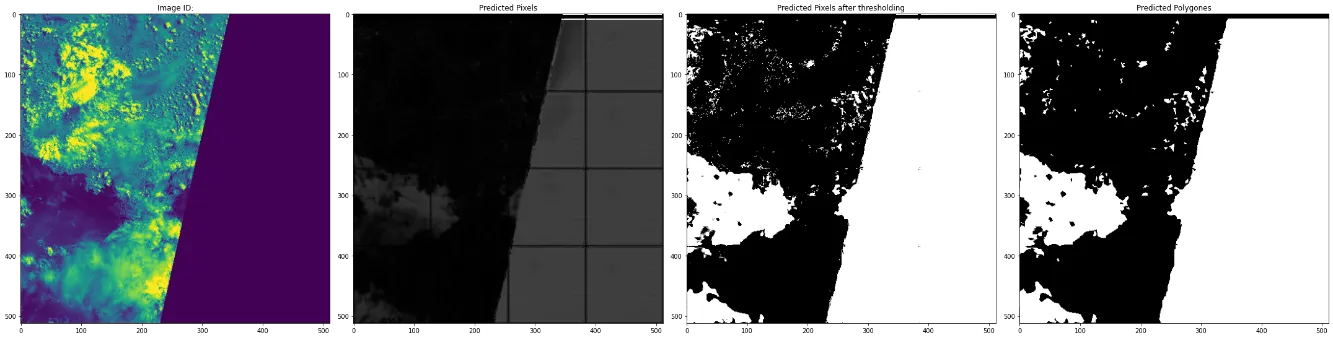
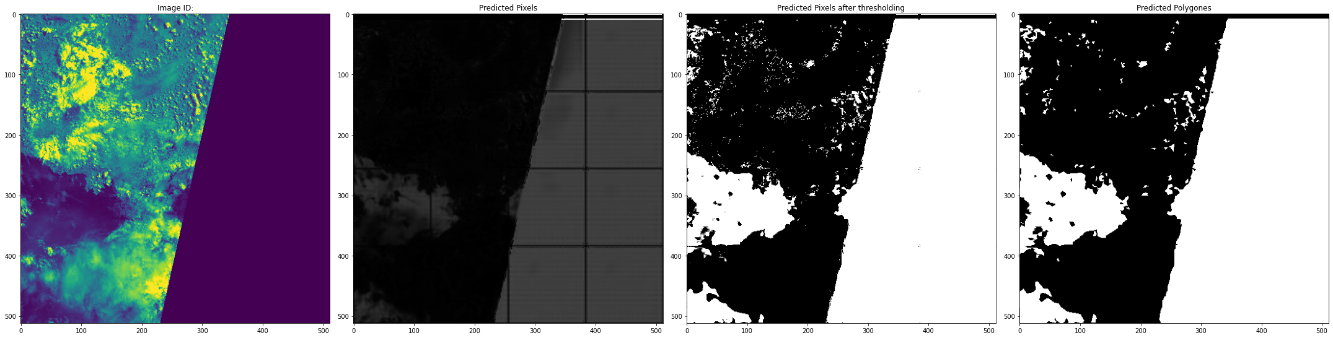
The pipeline runs from raw images and polygon labels to predicted masks and polygons in one notebook. Polygon labels were converted into a mask for each class. Tests showed that some multispectral bands outside red, green and blue picked out vegetation more clearly, so the multispectral images were used for training.
Memory on Google Colab limited the input size. Each image was resized to 512 × 512 pixels and split into 16 patches of 128 × 128, which kept enough detail in each patch without creating too many patches per image. About a quarter of the training data was held out for validation. Test images went through the same steps, and their predicted patches were stitched back together.
Predicted masks were turned into binary masks with a threshold set for each class, for example about 0.1 to 0.15 for buildings and 0.4 to 0.5 for crops. The masks were then traced into polygons in the same format as the labels.
- Pixels per training patch
- 128 × 128
- Patches per resized image
- 16
- Training data held out for validation
- About 25%
Comparing U-Net variants
Task lead · August–September 2021
Five architectures from the U-Net family were built from scratch in TensorFlow-Keras, with configurable depth, width and kernel size: U-Net, an ensembled U-Net, U-Net+, U-Net++ and MultiResUNet. Each used four levels, 128 filters in the first layer and 3 × 3 kernels, a balance between model size and patch size found by experiment. A second version of each model replaced upsampling in the decoder with transposed convolution.
The models were scored with the Jaccard index, or intersection over union, between predicted and labelled masks. The original U-Net scored highest overall, at 0.727. The denser models did not improve on it, probably because they overfitted the available data.
- Best overall intersection over union (U-Net)
- 0.727
- Architectures
- 5
- Model versions compared
- 10
| Upsampling decoder | Transposed-convolution decoder | |
|---|---|---|
| U-Net | 0.727 | 0.724 |
| Ensembled U-Net | 0.692 | 0.706 |
| U-Net+ | 0.692 | 0.696 |
| U-Net++ | 0.706 | 0.711 |
| MultiResUNet | 0.706 | 0.723 |
Testing on Sentinel-2 images and linking to risk scores
Final report · 2021
Finz planned to work with Sentinel-2 images, so the trained models were also run on Sentinel-2 scenes, where they marked trees, crops and water bodies. A separate task team wrote scripts to fetch and store Sentinel-2 tiles for Togo, Côte d’Ivoire and Cameroon.
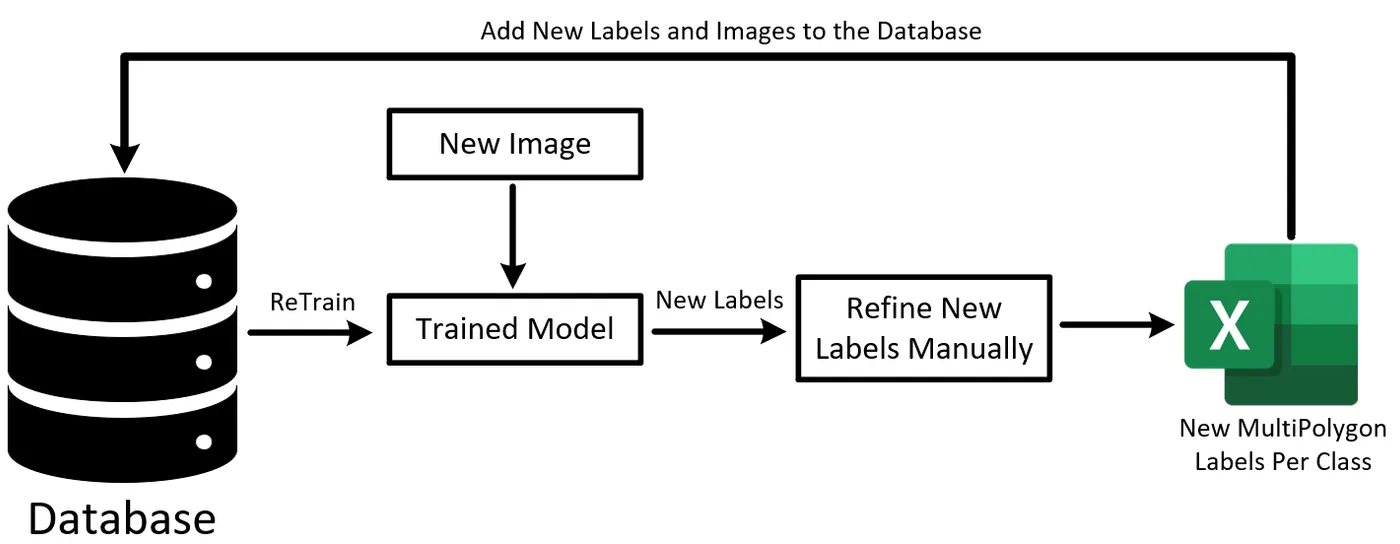
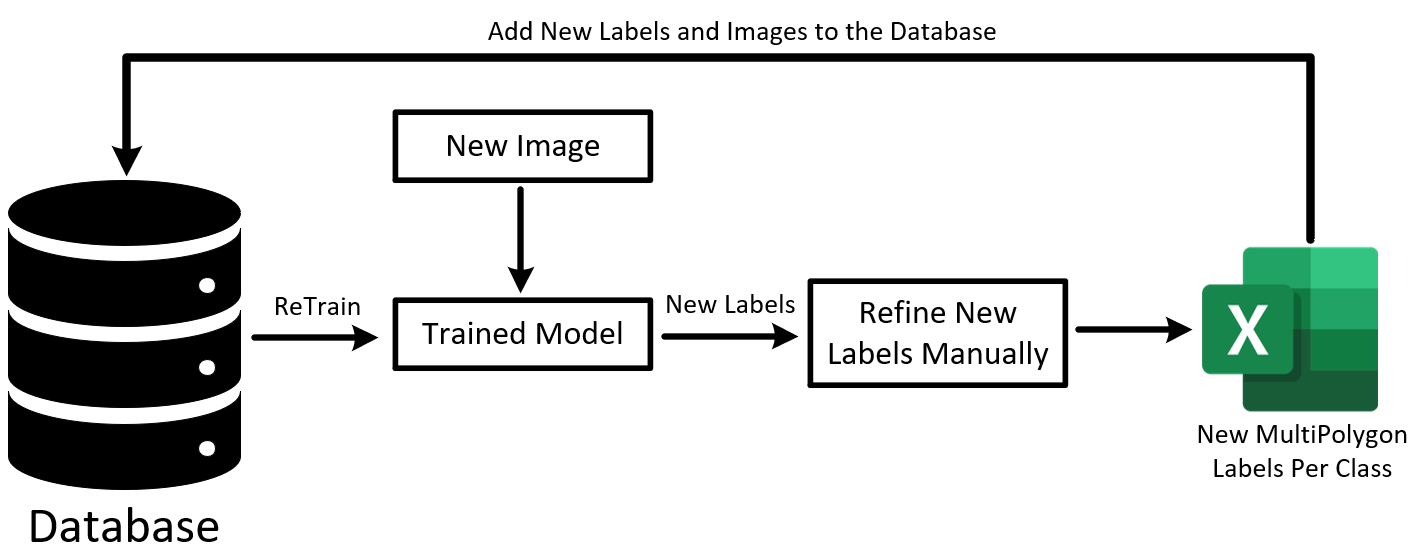
To grow the training data later, the pipeline can also label new images. A trained model proposes polygons, a person refines them, and the new labels are added to the database for retraining.
Within the wider project, segmentation was meant to add local detail to the team’s risk models. The share of a scene covered by a class follows from its pixel count: in a 512 × 512 image of 1 km², 100,000 water pixels would cover about 0.38 km², or 38% of the area. More water nearby, for example, could raise the weight given to flood risk. Combining these shares with the flood and geopolitical scores was left for follow-on work.
| What it provides | |
|---|---|
| Flood risk map for Togo | Five risk levels from a hazard map (rainfall, slope, drainage density and soil) and a vulnerability map (land cover, population density and distance to rivers) |
| Geopolitical risk score | Mean and maximum risk for a location in Côte d’Ivoire from conflict events recorded since 1997, weighted by time, distance and event type |
| Segmentation pipeline | Share of a 1 km² area covered by buildings, vegetation, water and other classes |
| Resources library | 210 datasets, articles, videos and tutorials gathered by the team |
My contribution
As Junior Machine Learning Engineer and leader of Task 4, I selected the dataset, built the TensorFlow segmentation pipeline, trained and compared the U-Net models, tested them on Sentinel-2 images and wrote the task report. I also worked with the other task teams on the overall model architecture.
Study scope
The models were trained on one labelled dataset from a single region, and the Sentinel-2 check was visual because those images had no labels. Within the eight weeks, the pipeline remained a separate tool and was not merged into the team’s risk scores.
Code
- TF-1D-2D-Segmentation-End2EndPipelinesResearch software and repository details