Biomedical devices & simulation · 2025
Rapid wall shear stress prediction for abdominal aortic aneurysms
A deep learning surrogate that predicts time-averaged wall shear stress on abdominal aortic aneurysms from 3D vessel geometry.
Qatar University IRCC-2020-002 · Qatar National Research Fund NPRP13S-0108-200024
Approach
Can deep learning provide a fast alternative to CFD for mapping wall shear stress on aortic aneurysms?
Low wall shear stress is linked with aneurysm progression and rupture risk, but computational fluid dynamics (CFD) is too time-consuming for rapid clinical use. This study built patient and synthetic aneurysm geometries, generated CFD references, converted each 3D shape into multiple 2D views, and trained MultiViewUNet to predict the wall shear stress pattern.
- Build geometries and run CFD
- Render multi-view images
- Predict wall shear stress
Building the aneurysm dataset and CFD reference
Medical & Biological Engineering & Computing · 2025
CT scans from 23 patients with abdominal aortic aneurysm, provided by Hamad General Hospital, were segmented into 3D aortic geometries. With guidance from clinicians, 10 synthetic variants were created from each patient geometry, giving 253 geometries in total.
Transient CFD simulations in ANSYS CFX covered three cardiac cycles, and the third cycle was used to calculate time-averaged wall shear stress (TAWSS). Each synthetic geometry took about one hour, and the synthetic set required 230 hours and 8 TB of storage.
- Aortic geometries
- 253
- Patient geometries, all held for testing
- 23
- CFD time per synthetic geometry
- ~1 h
| Training | Testing | Total | |
|---|---|---|---|
| Patient geometries | 0 | 23 | 23 |
| Synthetic geometries | 190 | 40 | 230 |
| All geometries | 190 | 63 | 253 |
Turning 3D geometry into image pairs
Medical & Biological Engineering & Computing · 2025
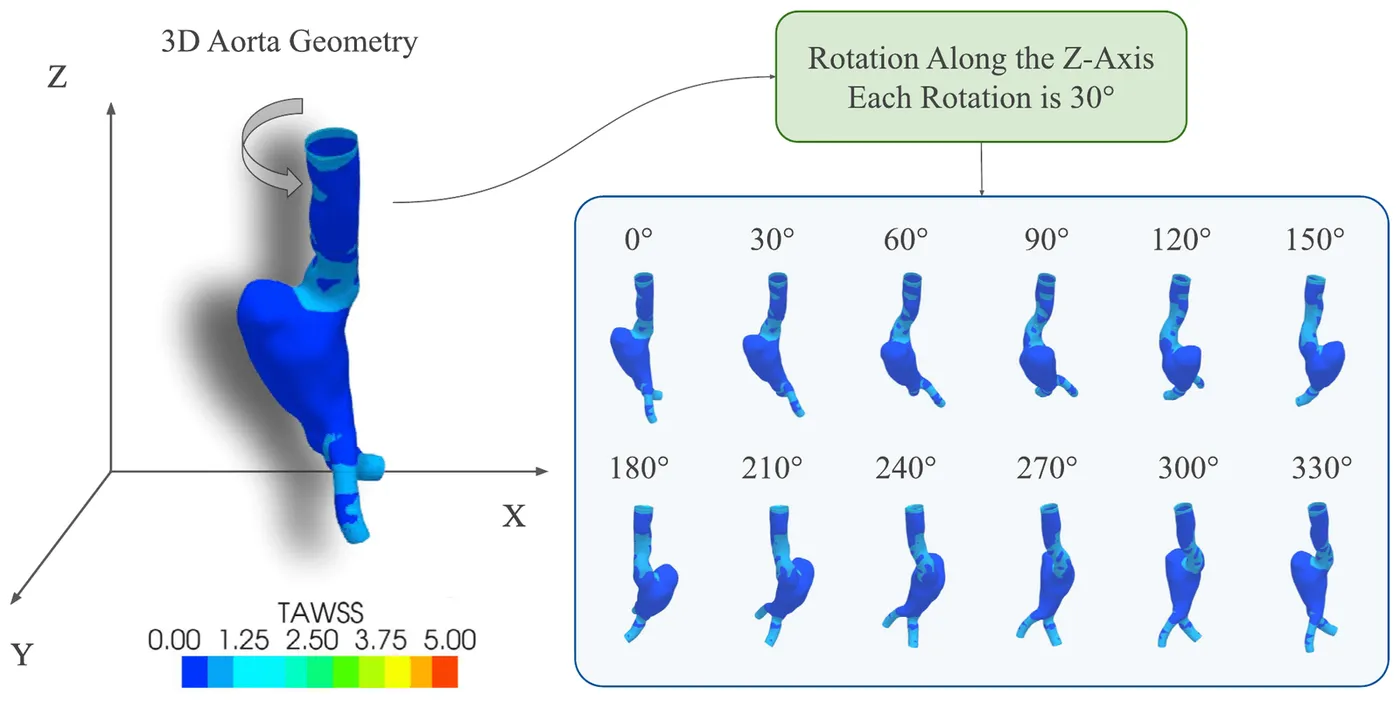
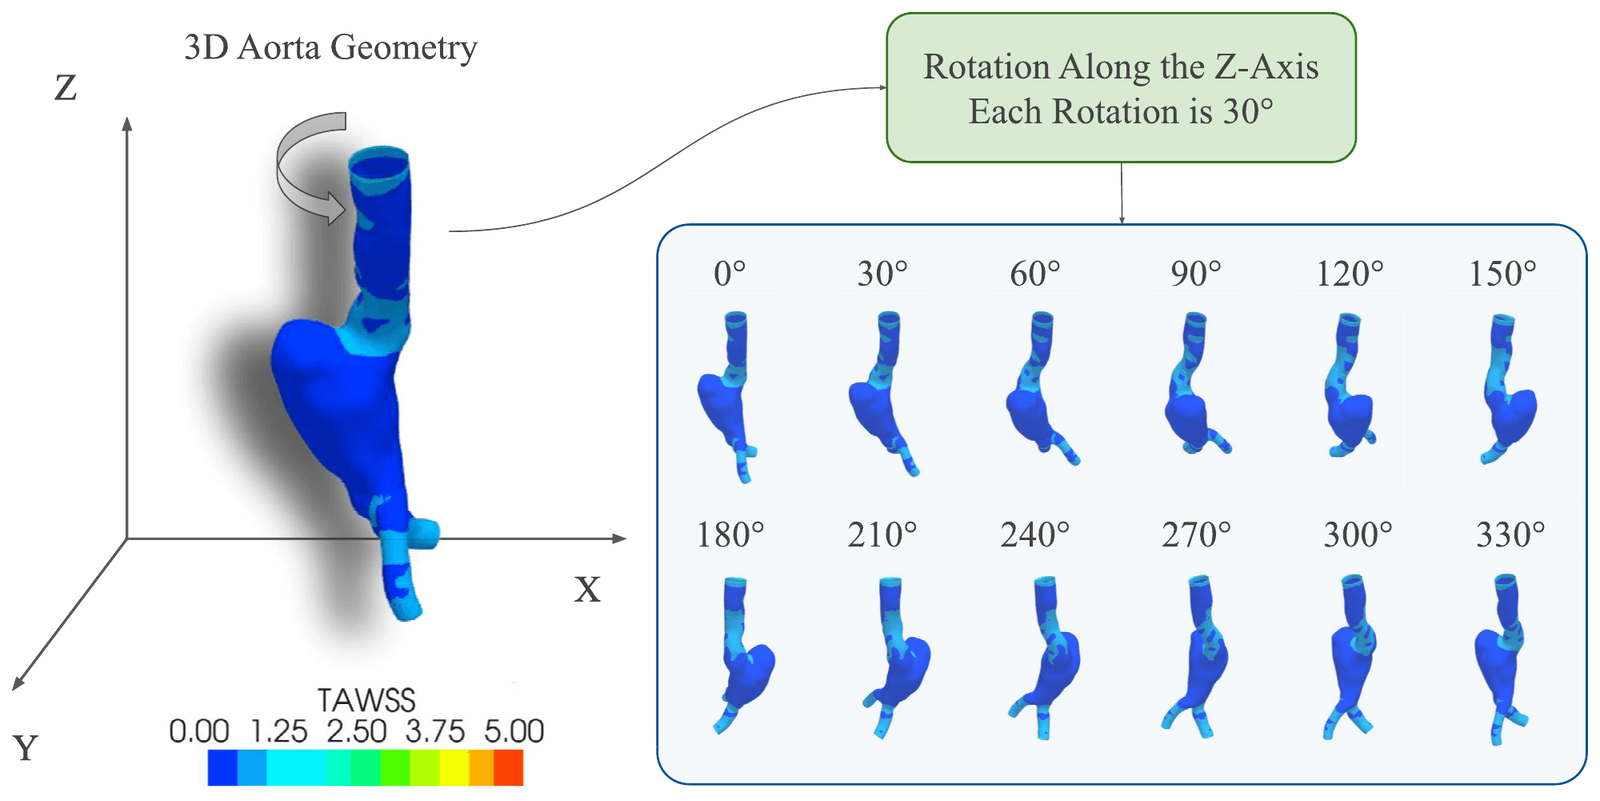
Each geometry was rendered from 12 angles by rotating it around its vertical axis in 30-degree steps, and the images were resized to 256 × 256 pixels. This turned a geometry-to-geometry problem into image-to-image translation and removed the need for every aorta to have the same number of mesh nodes.
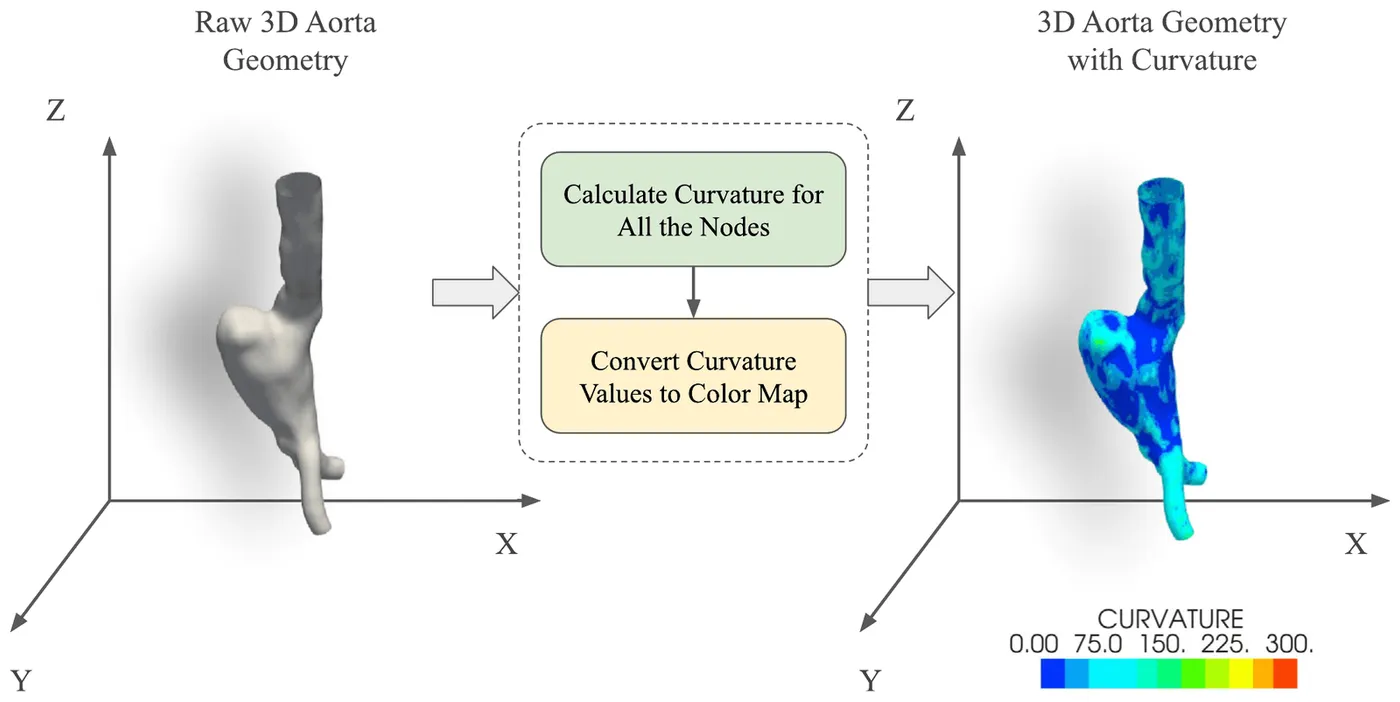
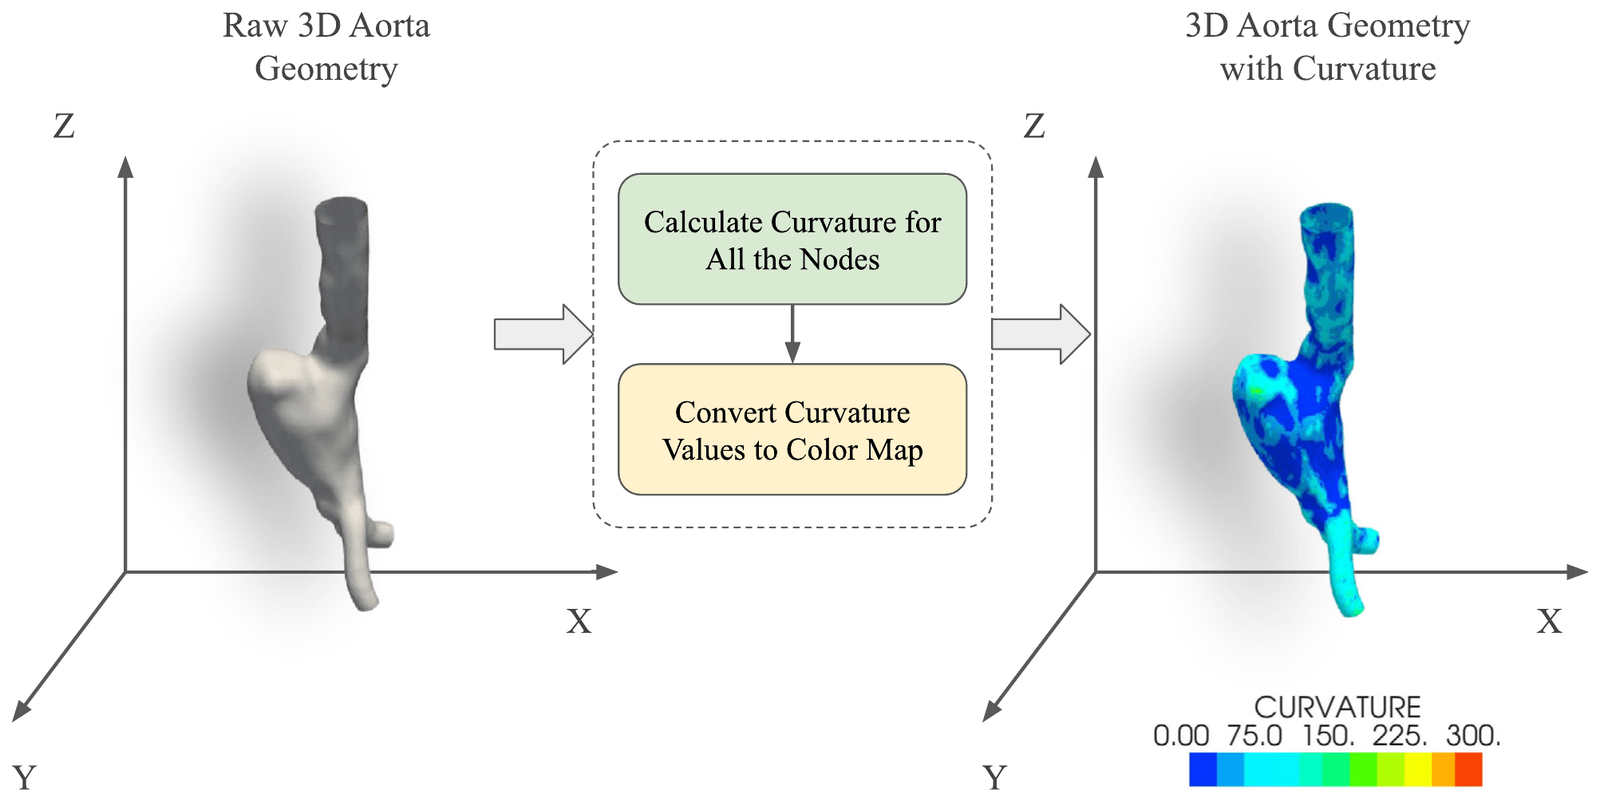
Surface curvature was added to the input as a colour map because it describes aneurysm shape directly. Compared with shaded geometry alone, curvature reduced the normalised absolute error and raised the effective peak signal-to-noise ratio by more than 6 dB.
- Rendered views per geometry
- 12
- Rotation between views
- 30°
- Image size used by the model
- 256 × 256
| NMAE | NMSE | NRMSE | EPSNR | |
|---|---|---|---|---|
| Shaded geometry | 0.402% | 0.086% | 1.316% | 23.67 dB |
| Geometry with curvature | 0.362% | 0.021% | 0.643% | 29.79 dB |
Predicting wall shear stress with MultiViewUNet
Medical & Biological Engineering & Computing · 2025
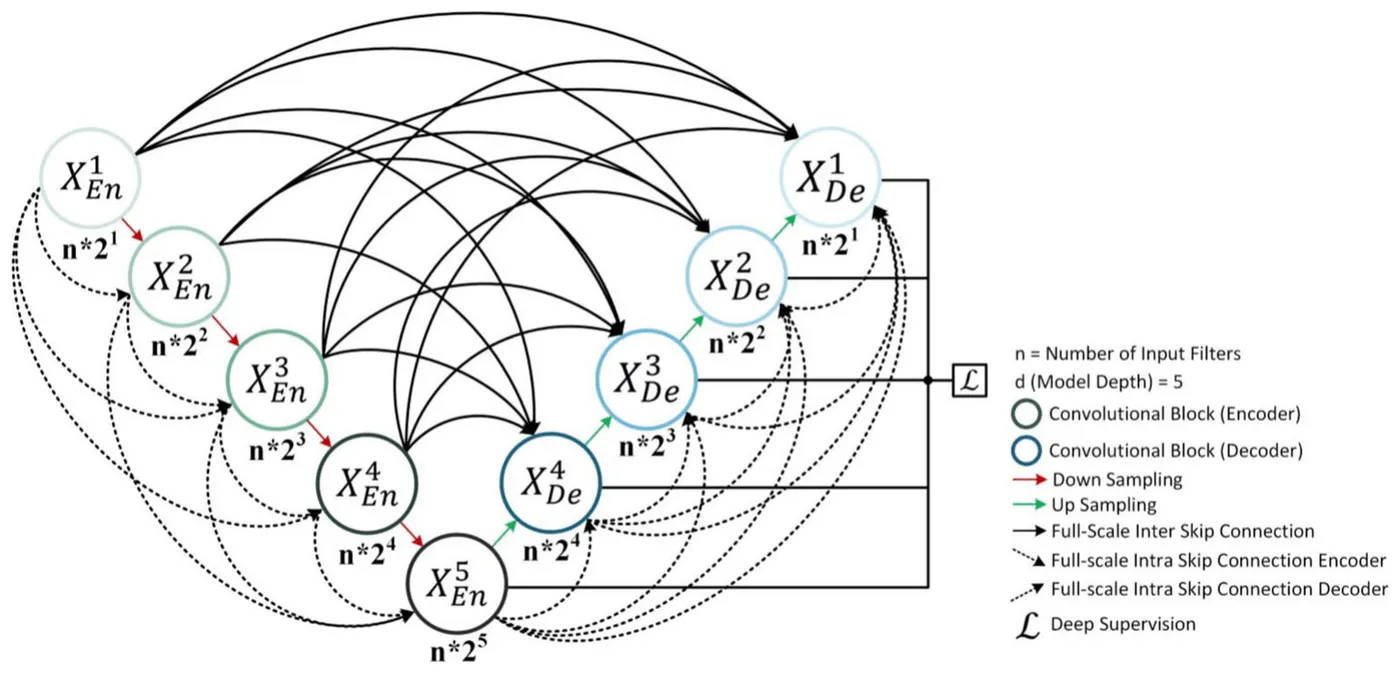
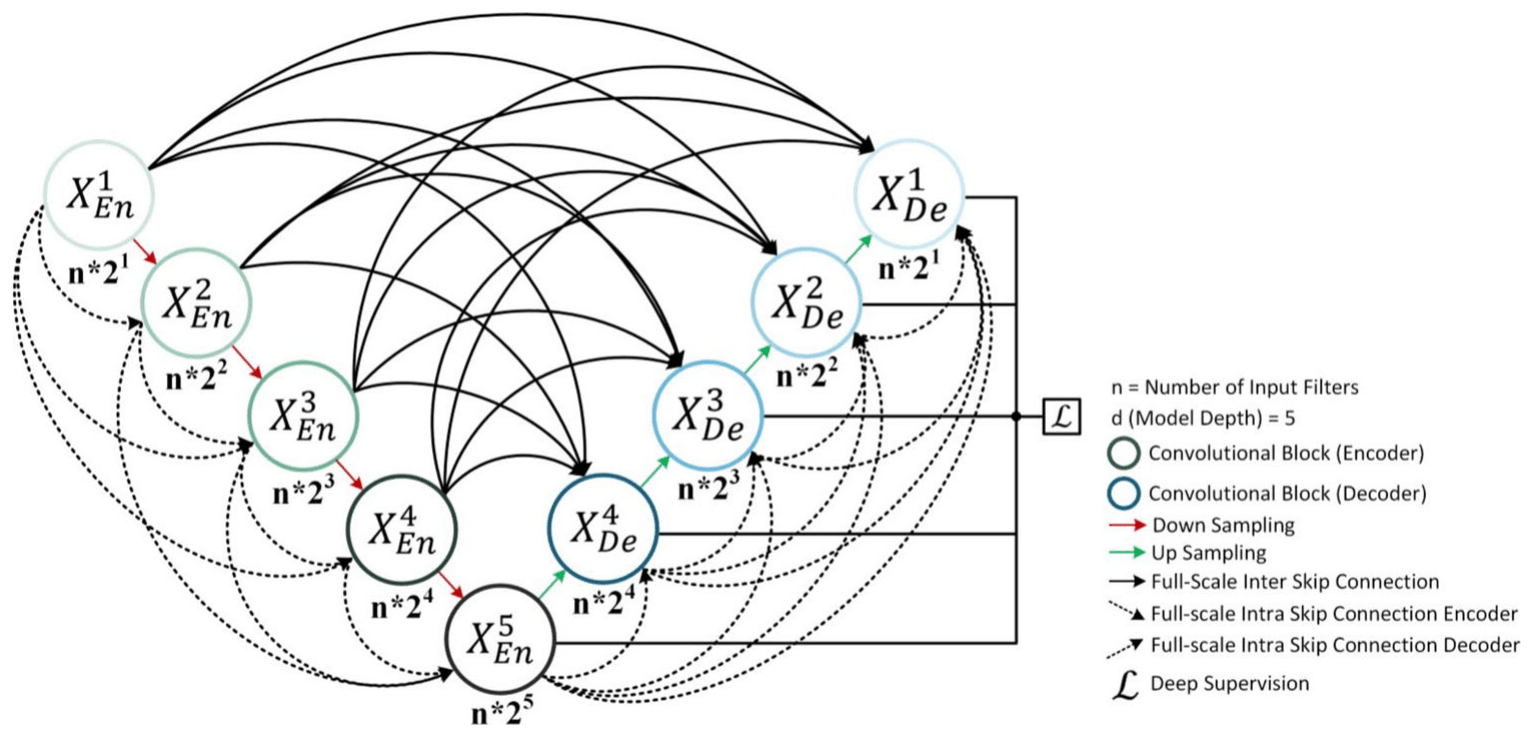
MultiViewUNet is a five-level image-to-image network that combines full-scale connections between its encoder and decoder with additional connections inside each path. It was trained with a loss calculated only over pixels belonging to the aorta, so the white background did not affect learning.
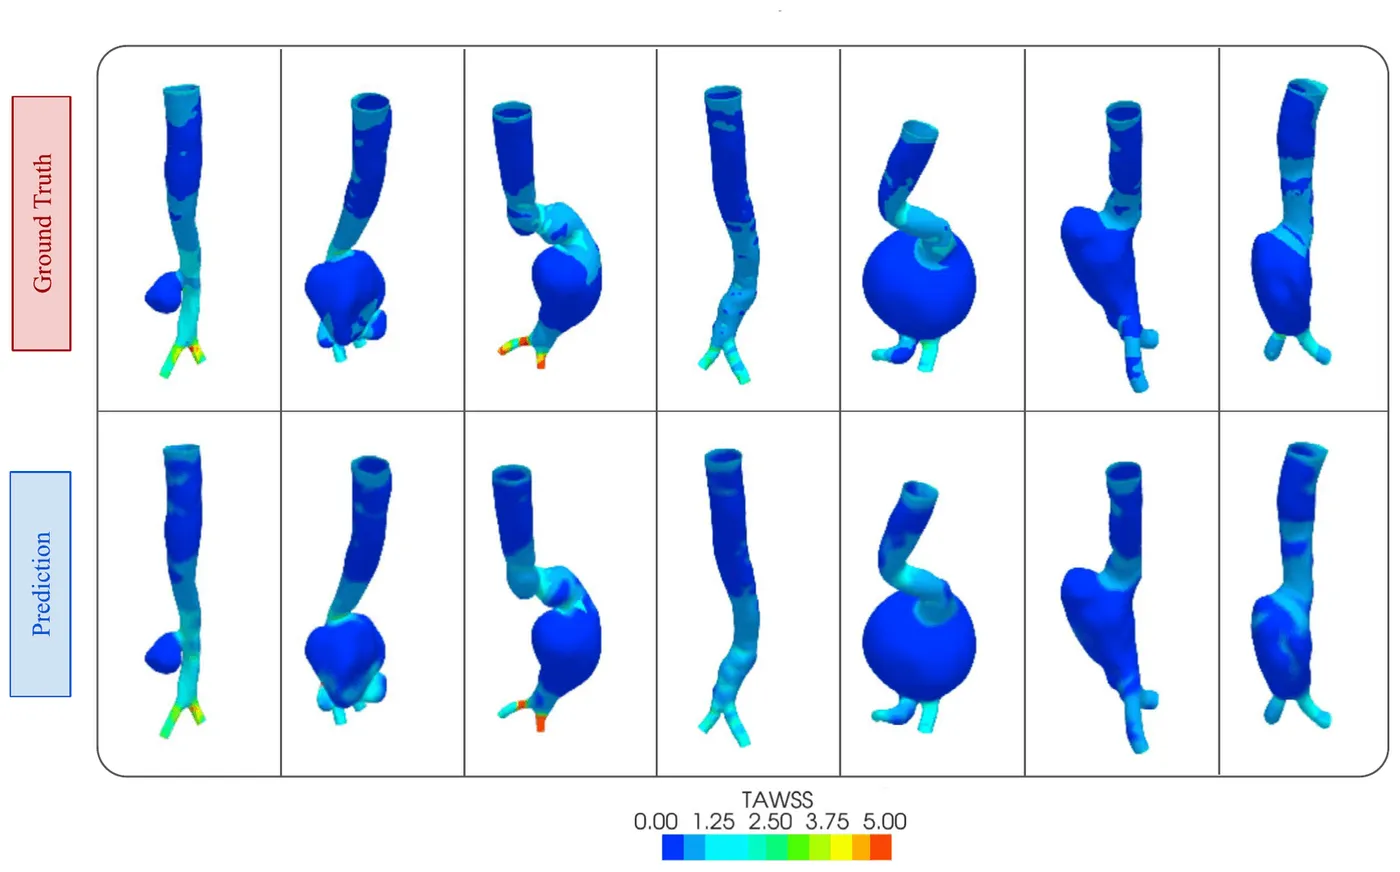
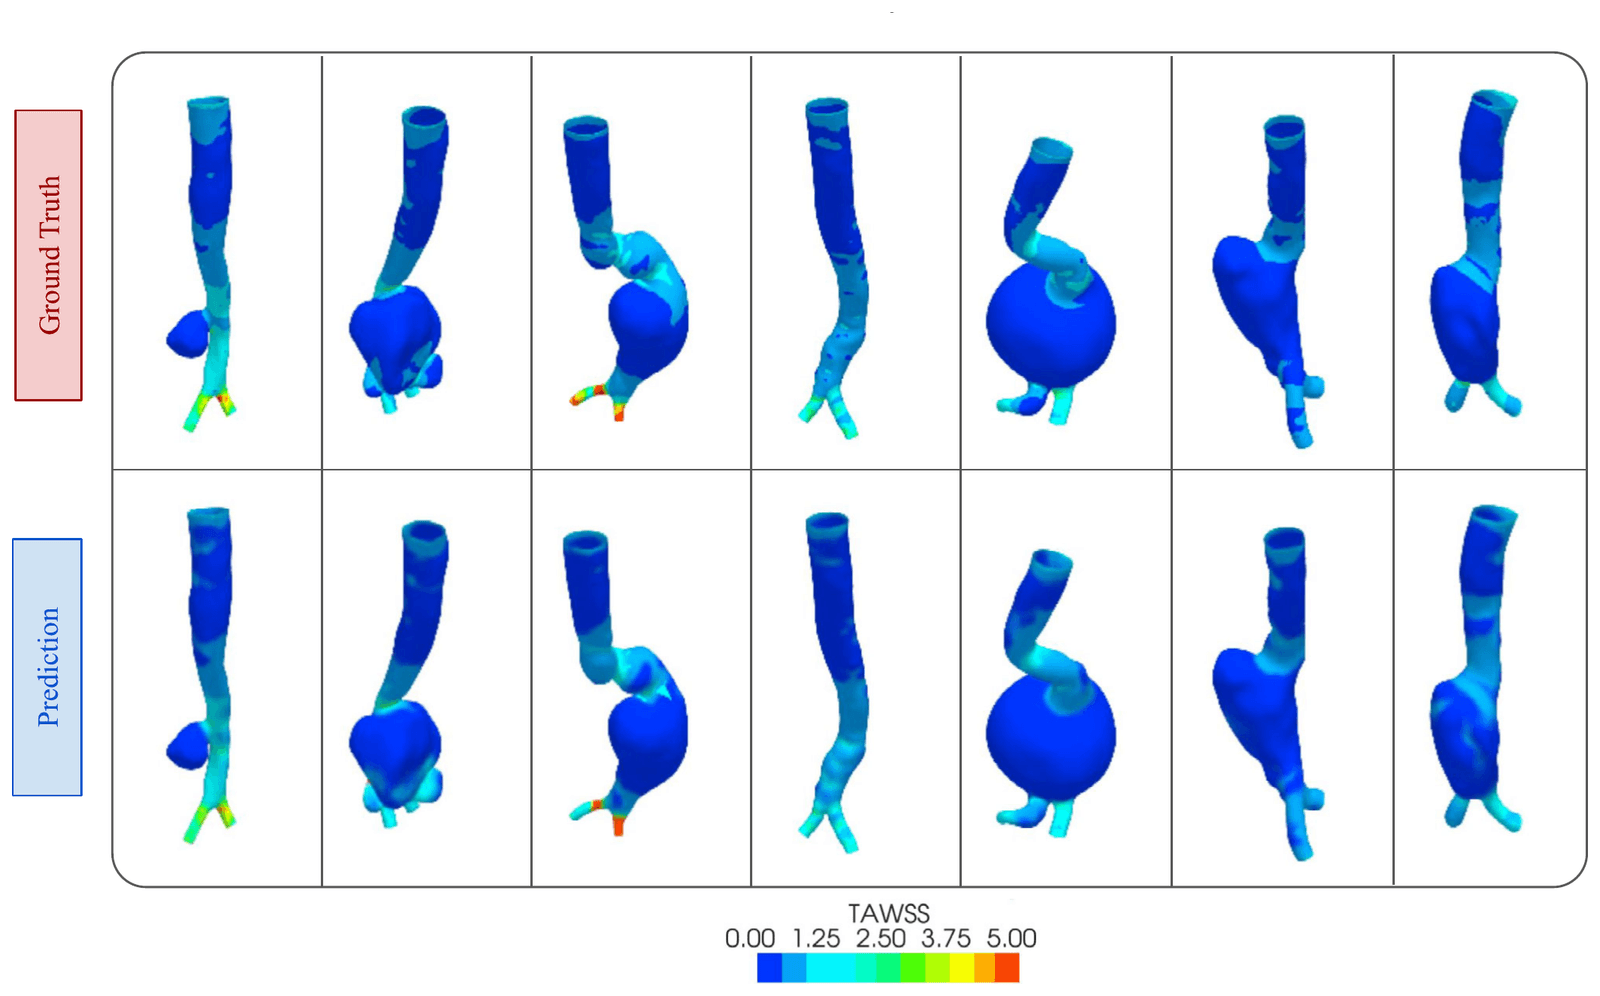
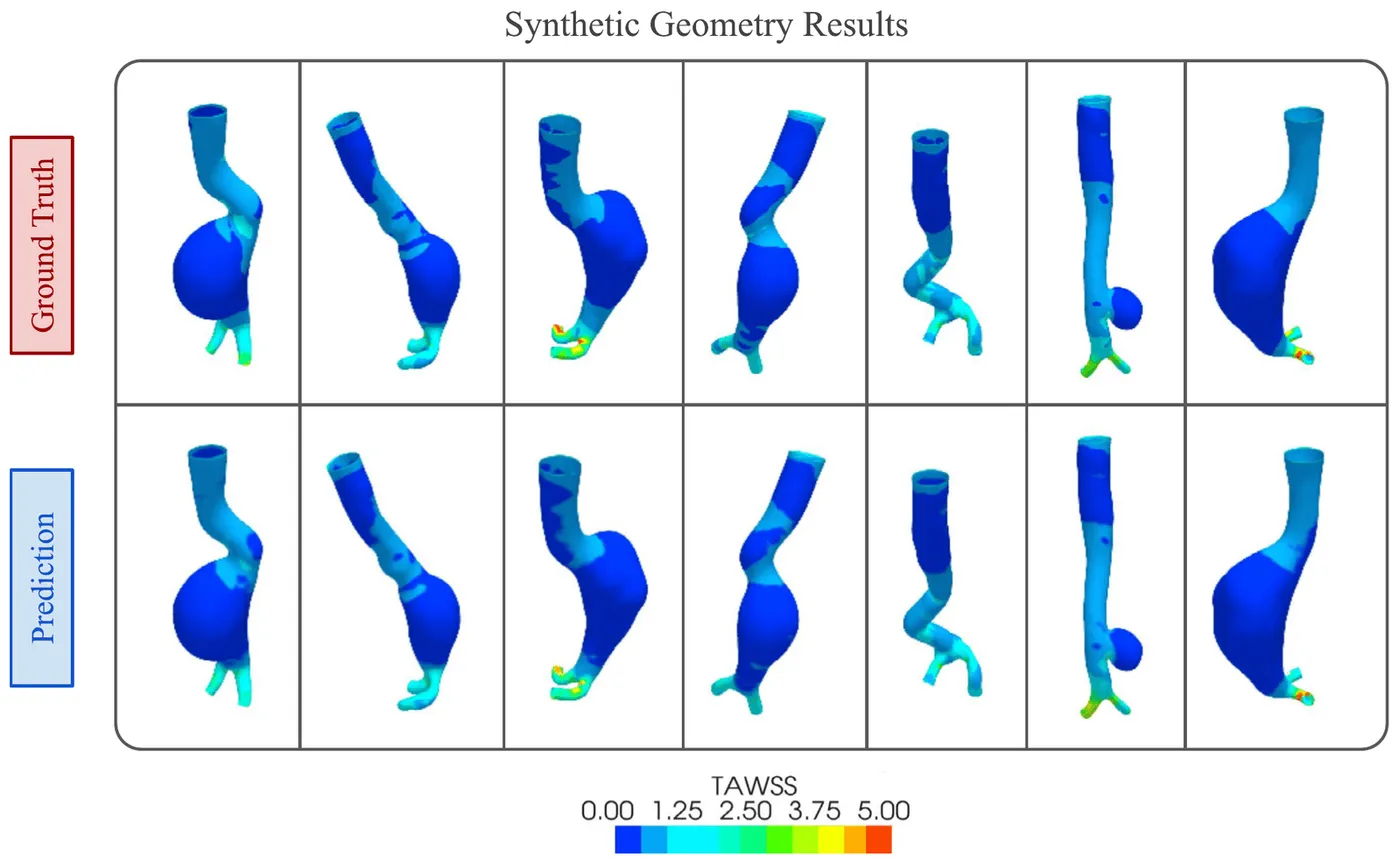
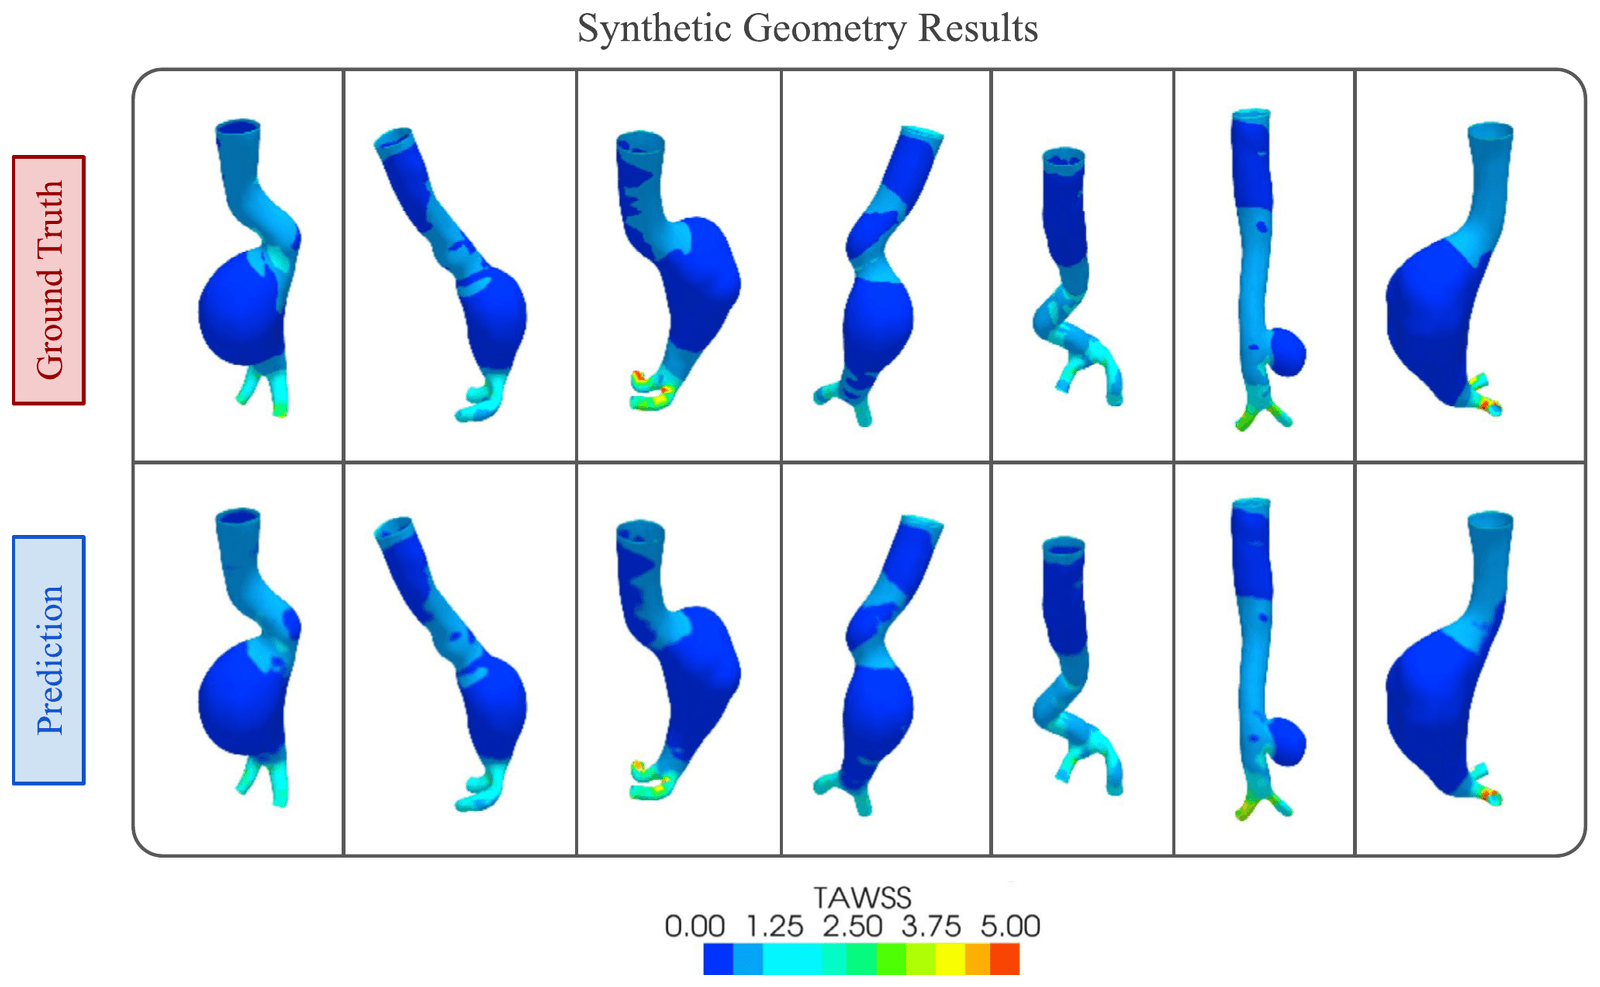
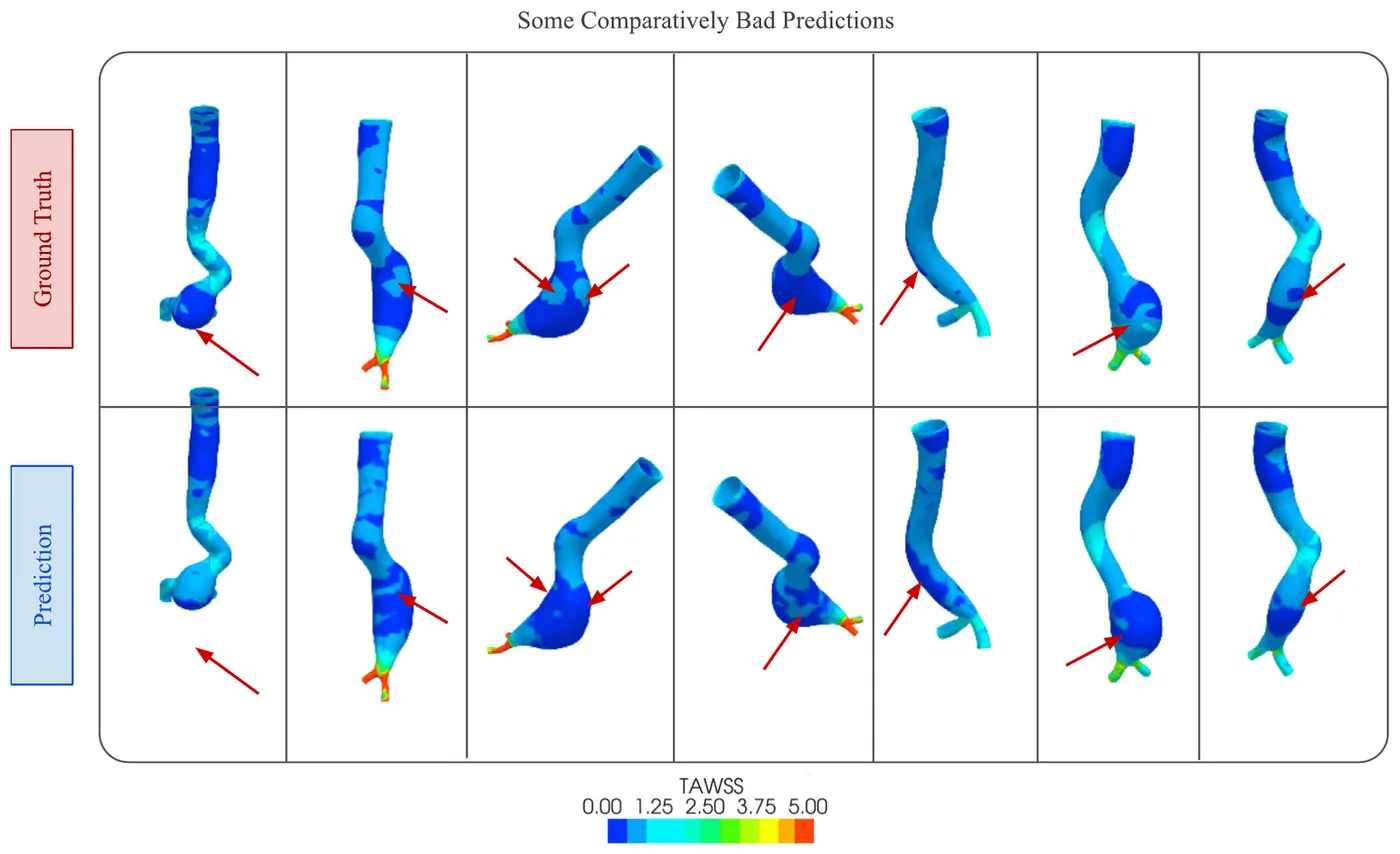
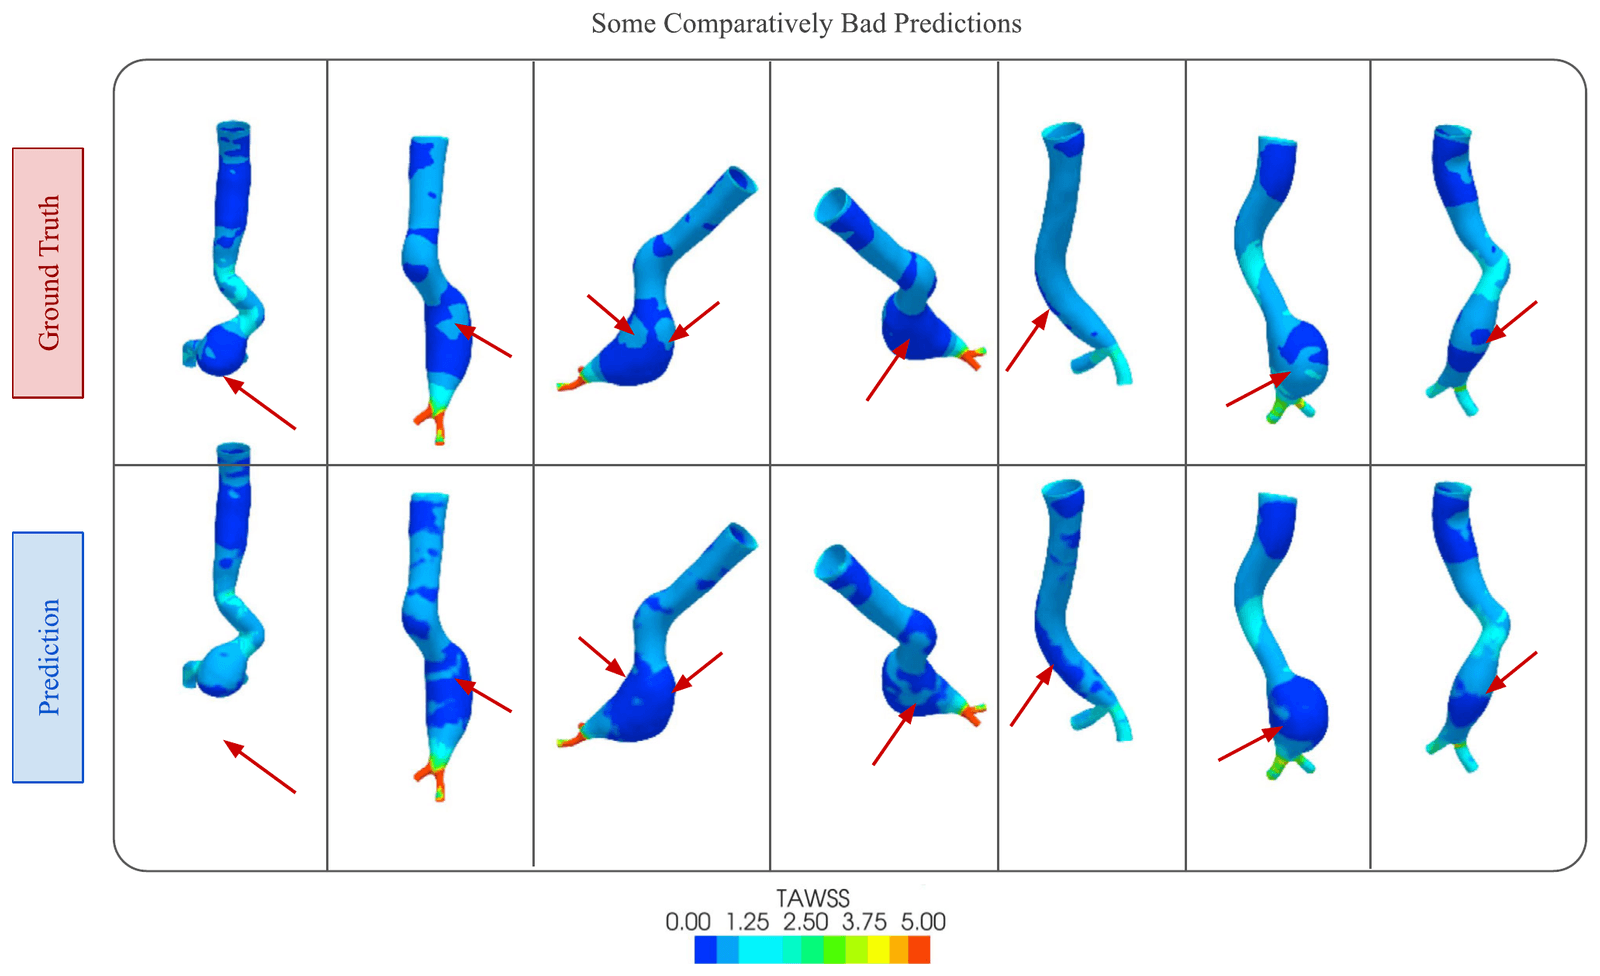
On the 63 held-out geometries, it gave the lowest image-based errors among the compared models. Predictions closely followed CFD on patient and synthetic geometries, with the largest differences in regions of disturbed flow.
- Normalised mean absolute error
- 0.362%
- Effective peak signal-to-noise ratio
- 29.79 dB
- Inference time on an NVIDIA T4 GPU
- 11.85 ms
| NMAE | NMSE | NRMSE | EPSNR | Inference time | |
|---|---|---|---|---|---|
| U-Net | 0.414% | 0.086% | 1.305% | 23.67 dB | 8.02 ms |
| Pix2Pix | 0.379% | 0.032% | 0.805% | 27.3 dB | 8.13 ms |
| PointNet | 4.52% | 0.573% | 7.57% | 18.3 dB | 6.45 ms |
| MultiViewUNet | 0.362% | 0.021% | 0.643% | 29.79 dB | 11.85 ms |
My contribution
I helped implement and integrate the deep learning model, evaluated successive versions, and troubleshot the modelling workflow with the core team.
Study scope
CFD was the reference, so agreement depends on the geometries, boundary conditions and simulation assumptions used. The dataset was relatively small, and errors were larger in disturbed flow. The model outputs 256 × 256 images rather than a reconstructed 3D surface, and other haemodynamic measures remain future work.
Publications
- Rapid wall shear stress prediction for aortic aneurysms using deep learning: a fast alternative to CFDMedical & Biological Engineering & Computing · 2025
Code
- MultiViewUNet-AneurysmResearch software and repository details